Installation:
The plugin is installed as any other from the official QGIS repository (In QGIS go to Plugins -> Manage and install … ). Be sure to enable experimental versions if you’re looking for the latest version.
In case the usual install doesn’t work, the plugin can be installed manually: First you need to locate your QGIS plugins folder. On Windows it would be ‘C:\users\username\AppData\Roaming\QGIS\QGIS3\profiles\default\python\plugins’ (do a file search for ‘QGIS3’ …)
Plugin code can then be extracted in a new folder inside the plugins folder (you should name the folder ViewshedAnalysis). Take care that the code is not inside a subfolder – the folder structure should be like this:
- QGIS3\profiles\default\python\plugins\
- [some QGIS plugin folders…]
- ViewshedAnalysis
- visibility_plugin.py
- visibility_provider.py
- [other files and folders…]
Workflow
Visibility analysis is broken down in two steps: first a set of observer points is created using Create observer points module, which are then fed to other modules.
Input data
- Digital elevation model: terrain model in a raster format (a pixel grid such as .tiff). Only projected raster data can be used. Latitude/longitude “projections”, such as WGS84 are not allowed.
- Observer/target points have to be stored in a shapefile or other recognised vector formats. Lines or polygons cannot be used (unless broken up in points). Multi-point shapefiles will not work, neither. In case when point’s coordinate system differ from the elevation model used, the vector data will be reprojected to match.
[I repeat: do not use unprojected data in degrees (Lat/lon, WGS 84), such data is inappropriate for precision calculation. Be sure to understand GIS projections before mailing me…]
Modules
Create observer points
This is the first step for the visibility analysis. The observer points in the input will be processed and written as a geopackage file with standardised field names. Data will be reprojected to match the elevation model used, if needed. Data inside the table can be changed manually – but the names and data types of fields should remain unchanged.
Parameters
Mandatory parameters can be set as fixed values, while all parameters may be read from table fields. The latter method is prone to errors : in case of a problem (e.g. an empty field) the fixed value specified in the text box will be applied, or a default value. If in doubt, check the generated file and Log Messages (Viewshed info).
- observer IDs: viewpoints can be assigned individual names or id numbers, stored in the associated table. Otherwise, internal ids will be used (sequential numbers).
- Observer height: in meters
- Target height: height value to be added to all terrain areas checked for visibility from the observer point.
- Radius of analysis: maximum distance for visibility testing, in meters
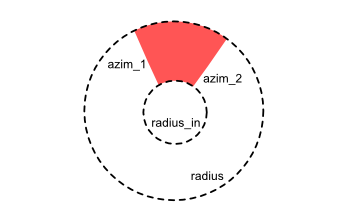
Five additional parameters can be used to mask out specific areas.
- Inner radius will exclude the circular area around the observer point, up to the specified distance.
- Azimuth start/stop will exclude the area that does not lay between two specified azimuths. Note that the start azimuth may have a higher value than the end azimuth. Both 10 to 30 degree range and 30 to 10 are valid, but the latter option will allow all directions except the 10 to 30 range.
- Upper/lower angle determines the maximum/minimum angle of vision. Areas above/below these values will be excluded, that is, registered as not visible. Horizontal (eye) level is at 0 degrees, angles below the hor. level can reach up to -90 degrees, and above the hor. level up to +90 deg. The specified lower angle has to be smaller than the upper angle.
Viewshed
This module performs a visibility calcualtion for individual points over a terrain model (in a raster grid format). Three output types are available:
- Binary viewshed will produce a visibility map where each data point of a terrain model will be assigned a true/false value (visible/not visible).
- Depth below horizon will provide the depth at which lay invisible portions of a terrain. The value produced by this module can be understood as the theoretical height a construction should attain in order to appear on the horizon, as visible from the chosen observer point.
- Horizon option will trace the outer edges of a viewshed, which represents points that appear on the horizon from a chosen observer point.
When multiple observer points are used, individual viewsheds will be combined into a cumulative viewshed model representing the number of positive results for each data point.
Parameters
- Observer points are vector layers created by the Create viewpoints routine.
- Combining multiple outputs: when multiple observer points are used, individual viewsheds will be combined in a single model, either by an addition of values or by selecting the lowest or the highest values. Note that addition is appropriate for binary (true/false) output. Depth values, on the other hand, may be filtered for the highest or the lowest ones.
- Earth cuvature and Refraction: see below.
Intervisibility network
The output of the intervisibility network routine is a network, in vector format, of visual relationships between two sets of points (or within a single set). For each link the depth below/above visible horizon is calculated, as in many cases only a portion of the specified target is visible.
Parameters
- Observer points and Target points are vector layers created by the Create viewpoints routine. Note that each point can be both, observer and target: the height as target is always stored in the
target_hgtfield. (!) Target height is defaulted to zero if not specified. - Save negative links: when allowed, non-visible relationships will be registered. These are recognisable as negative values of the
TargetSizefield. - Earth curvature and Refraction: see below.
Visibility index (total viewshed)
This module calculates the visual exposition of each data point – a pixel – for a given terrain model. The Index is calculated as the proportion of positive views, returning 1.0 when all views are positive. Note that this is a very complex calculation which may take up to a couple of hours for moderately large datasets. In order to reduce execution time, only a sample of lines of sight is taken into account (between 8 and 64).
Parameters
- Sample : the number of lines of sight that radiate from each observation point. Higher numbers always result in significant increase in execution time. It is advisable to experiment with varying sampling schemes over a smaller area, prior to execute the analysis over the entire dataset.
- Direction : For each analysed point, we can record either incoming views (how many people can see me?), or outgoing views (how many people can I see ?). Note that cumulative viewshed may be used to produce the model of incoming views, but not the outgoing ones.
Other parameters are the same as for other modules. For further detail, check https://landscapearchaeology.org/2020/visibility-index/
Earth curvature and refraction
Similar to other viewshed algorithms available, it is possible to account for effects of the Earth’s curvature and refraction of the light when travelling through the atmosphere. The latter effect is due to differences in density and in composition between layers of the atmosphere, as for instance between air and water. These parameters are insignificant over smaller distances, especially for coarse grained terrain models.
Following formula is used to adjust height values in the DEM:
z adjusted = z - (Dist² / Diam Earth ) * (1 - Refraction)
Where: Dist: The planimetric distance between the observation point and the target point. Refraction: The refractivity coefficient of light (normally it has the opposite, but smaller, effect than the curvature). Diam: The diameter of the Earth that is estimated as Equatorial radius + Polar radius. These values are taken from the projection system assigned to the Raster by QGIS. In case of error or unrealistic values, the default radius of 6378.137 kilometers and flattening of 298.257 are used.
For more explanation see ArcGIS web page
General settings
These are accessed under Processing Options (search for Providers >> Visibility Analysis)
- Activate: self explanatory…
- Maximum buffer size: when working on multiple points, the algorithm can either hold all data in live memory (which is faster), or select, for each point, a smaller window corresponding to the specified radius (which is significantly slower). The second approach will be used when the size of terrain model used (DEM) exceeds the specified buffer threshold. It is expressed in megapixels (explained also here).
Dependencies
The plugin is coded in Python 3.6 and does not require any additional libraries than those provided by standard QGIS installation. These libraries include numpy and gdal for manipulating raster data, and PyQt5 and QGIS core libraries for integration with QGIS.
GitHub Repository
https://github.com/zoran-cuckovic/QGIS-visibility-analysis
…PS: observer vs target height
It is very important to fully understand the parameters for observer and target height. Imagine that you have someone in a tower, looking out from the 3rd floor. The tower has 10 floors. These are the parameters that may be used for specific types of analysis:
| Analysis type | Observer height | Target height |
| viewshed from the 3rd floor | 10 m | 0 |
| viewshed from the 10th floor | 30 m | 0 |
| visibility of the tower (maximum) | 30 m | 1.7 m |
| visibility of the tower (realistic) | 20 m | 1.7 m |
| visibility network (top to top) | 30 m | 30 m |
| visibility network (3rd floor to top) | 10 m | 30 m |
What’s happening here ? The terminology may be a bit confusing for the “reversed” viewshed, i.e. when observers look towards the focal point (ArcGis uses terms offset A, offset B). This approach is typically used to analyse a building in its surroundings; in that case we simply swap the observer and target height parameters in order to simulate scattered observers. In a visibility network, an object can be at the same time a vantage point and a visual target. The observer height does not stand for the building height, which is specified as its target height.