So, you have your data, you’ve installed a GIS program … and there we go: slope gradient – check, solar exposition – check, water drainage – check, visibility range – check …
But somehow, the outputs don’t seem right: things don’t fall where they should, values go off by hundreds and your maps just look strange.
Nine out of ten cases when QGIS plugins that I maintain “do not work” are due to geographic projection errors. Based on this experience, and on what I see around, I would go as far as to estimate that the majority of raster based GIS analyses being done today is flawed. The main reason is the lack of proper projection management. Don’t believe me? Take a look at your own models, after having read this.
Simply put, modern GIS works with just about anything that can be thrown inside. So, let’s try a visibility analysis with a piece of freely available SRTM elevation model (provided by NASA). I’m using SAGA GIS software.
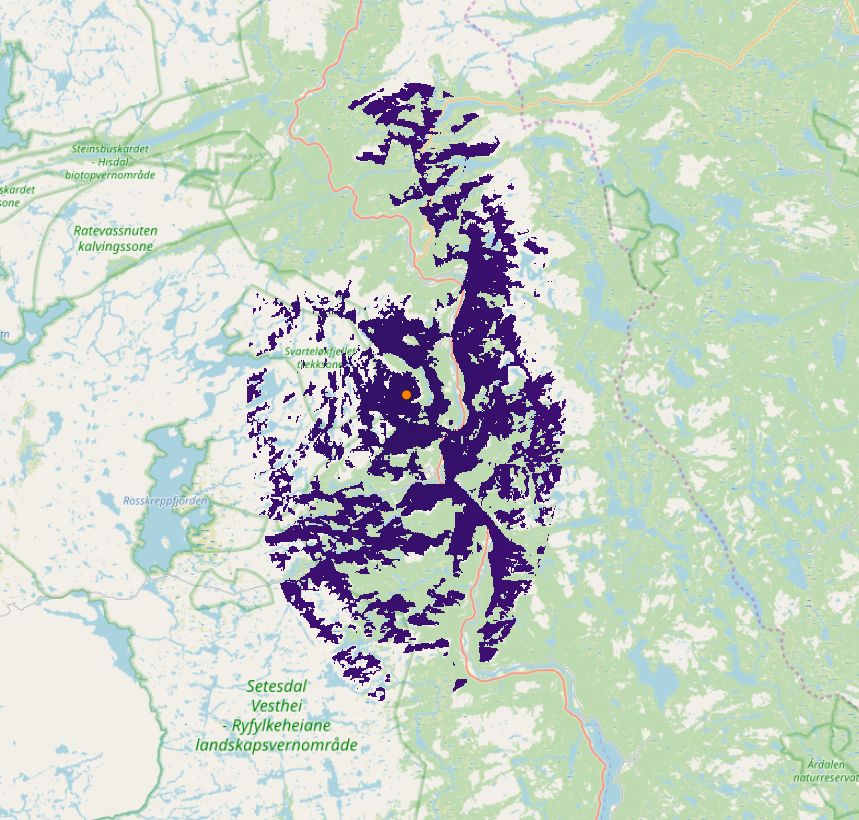
 Viewshed analysis made over a raw SRTM dataset (observer point is marked by an orange dot).
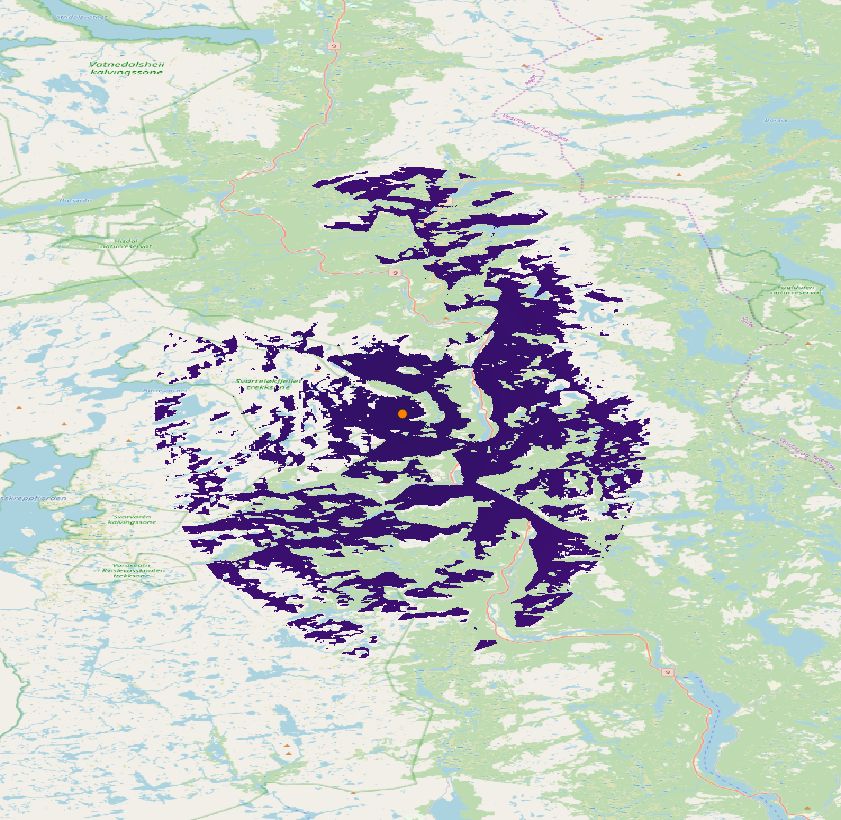
Whoa ! How come the visible range has a shape of an ellipse ? Well, we can make it round, but then the background topography gets unrealistically stretched out.

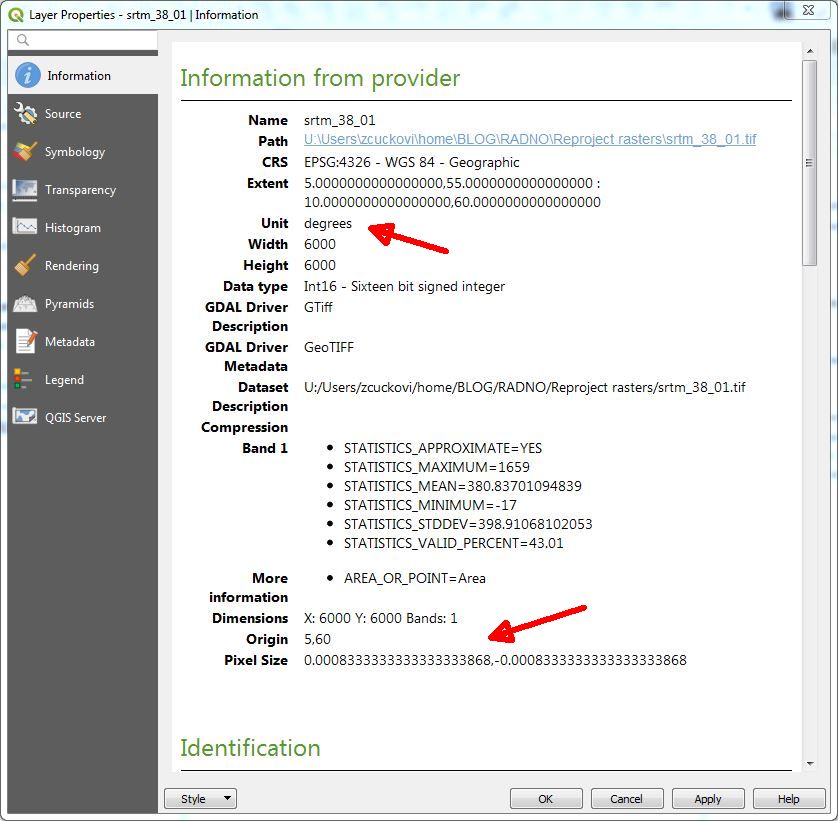
What is happening here? Let’s take a look at the information associated with our elevation data.

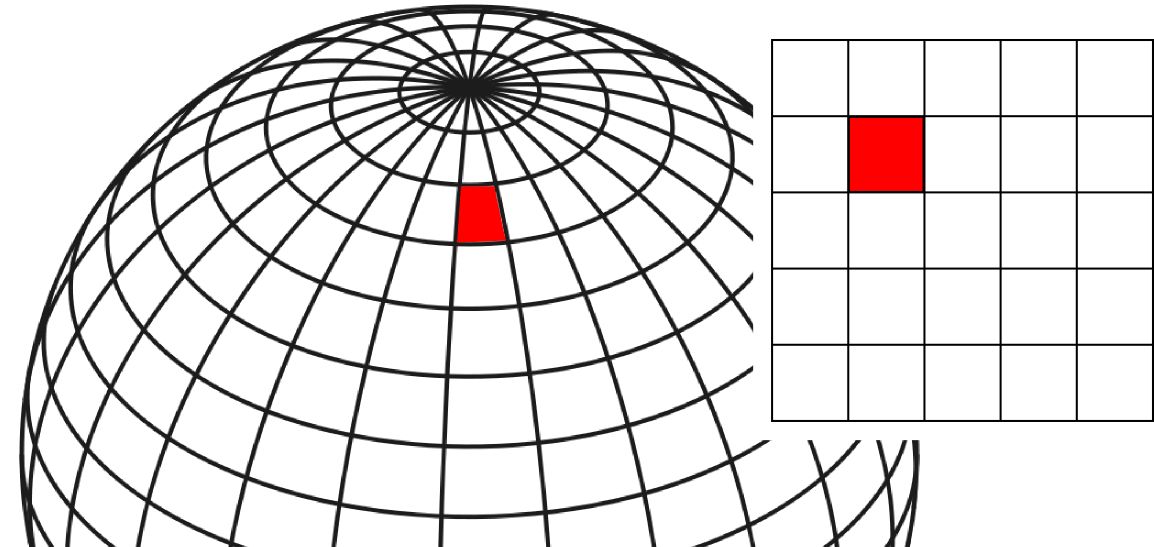
We can see that our data is in degrees, and that our pixel size is 0.000-something, which cannot be meters (in that case, a pixel would be smaller than a millimetre!). What does a degree unit look like ? Well, we can only represent it in 3D because it is curved in 3 dimensions: figure below.
 One angular unit in a latitude/longitude grid vs one pixel unit in an image grid.
Latitude/longitude grid, such as the one above, can be seen in any GIS manual and is commonly featured on maps. How come, then, that it causes problems in GIS? Well, the truth is that the majority of raster GIS modules borrow their design from image analysis algorithms. These feed on pixel grids and don’t care about geography. The problem with our visibility analysis is that it interpreted elongated, curved units as square pixels.
What your GIS program sees is in most cases just an image composed of supposedly square pixels. Deformed angular units will totally skew the result. This is valid for almost any raster based analysis.
These two hillshades were made using QGIS Hillshade algorithm. The one made over un-projected dataset is stretched to its full value range, its shading cannot be adjusted any further. Apparently, it is pretty much useless. Note, however, that I chose a piece of terrain from Norway, where the angular deformation is rather extreme as meridians converge in direction of the North Pole. Analysis bias will diminish progressively as we move south – but it will never disappear completely.

We can now name our enemy: it is called WGS 84 and its code is 4326. It’s an imposter, a fake, it purports to be a valid geographic projection but it’s not. Yes, most of available remotely sensed data is in WGS 84 coordinate reference system, but this only means that the data lacks a proper projection. WGS 84 is just a flag telling you not to do anything with the data before projecting it.
Recap
Modern GIS software has automated coordinate transformations, but it is unfortunately too permissive, especially concerning raster data. The worst thing is that errors are often difficult to perceive and even less so to understand. Your hillshade is a little too shady when you change the sun angle: it must be the QGIS algorithm, right?
If you are a regular GIS user, I’m challenging you: how many WGS 84 hillshades are sitting on your computer? Did you take pain to re-evaluate your data accuracy after re-projection?
Geographic projections will continue to bother us and trusting in GIS automation is definitely not the way to go. Quite often, things “work” just because the software is too forgiving. Conversely, some other algorithms “do not work” (such as my Viewshed analysis module) because they are less permissive, not because they’re broken. So, as soon as you download your WGS 84 data, re-project it and delete WGS84 files from your computer, your GIS life will be easier…
PS
You can find an interactive example of projection distorsions at https://mathigon.org/course/circles/spheres-cones-cylinders#sphere-maps