Viewshed analysis produces a model of visible areas from a chosen point, given a 2.5 or 3D elevation model. Most often, we model full range visibility, in all directions from an observer point, but such models may not satisfy all uses. For instance, we are sometimes interested in a scene that an observer can see in front of him/her, excluding the scenery behind his/her back. We may also prefer to exclude certain zones for various reasons, for instance when we model different visibility ranges (close, middle, far).
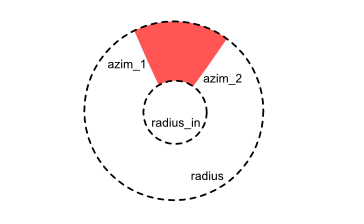
A single visibility model can easily be tailored by deleting unwanted zones, but the problem is not trivial when dealing with hundreds of viewsheds. Starting with the 1.1 version of the Viewshed analysis plugin for QGIS users will be able to define a doughnut & wedge shaped mask for each visibility model by associating three parameters with each observer point. These are entered in the observer points data table, under columns radius_in (inside radius), azim_1 and azim_2 (azimuth angles that limit the wedge zone). Note that in the circular domain of angular variables both, 300 to 20 and 20 to 300 ranges are valid; they cover two opposite sectors.
Directional viewshed analysis: a tutorial
Our example will be a section of the beautiful Premužić trail which is following the main ridge of the Velebit mountain, Croatia. The trail was built in the 1930’s specifically for hiking, and is truly a masterpiece (see on NP Velebit).
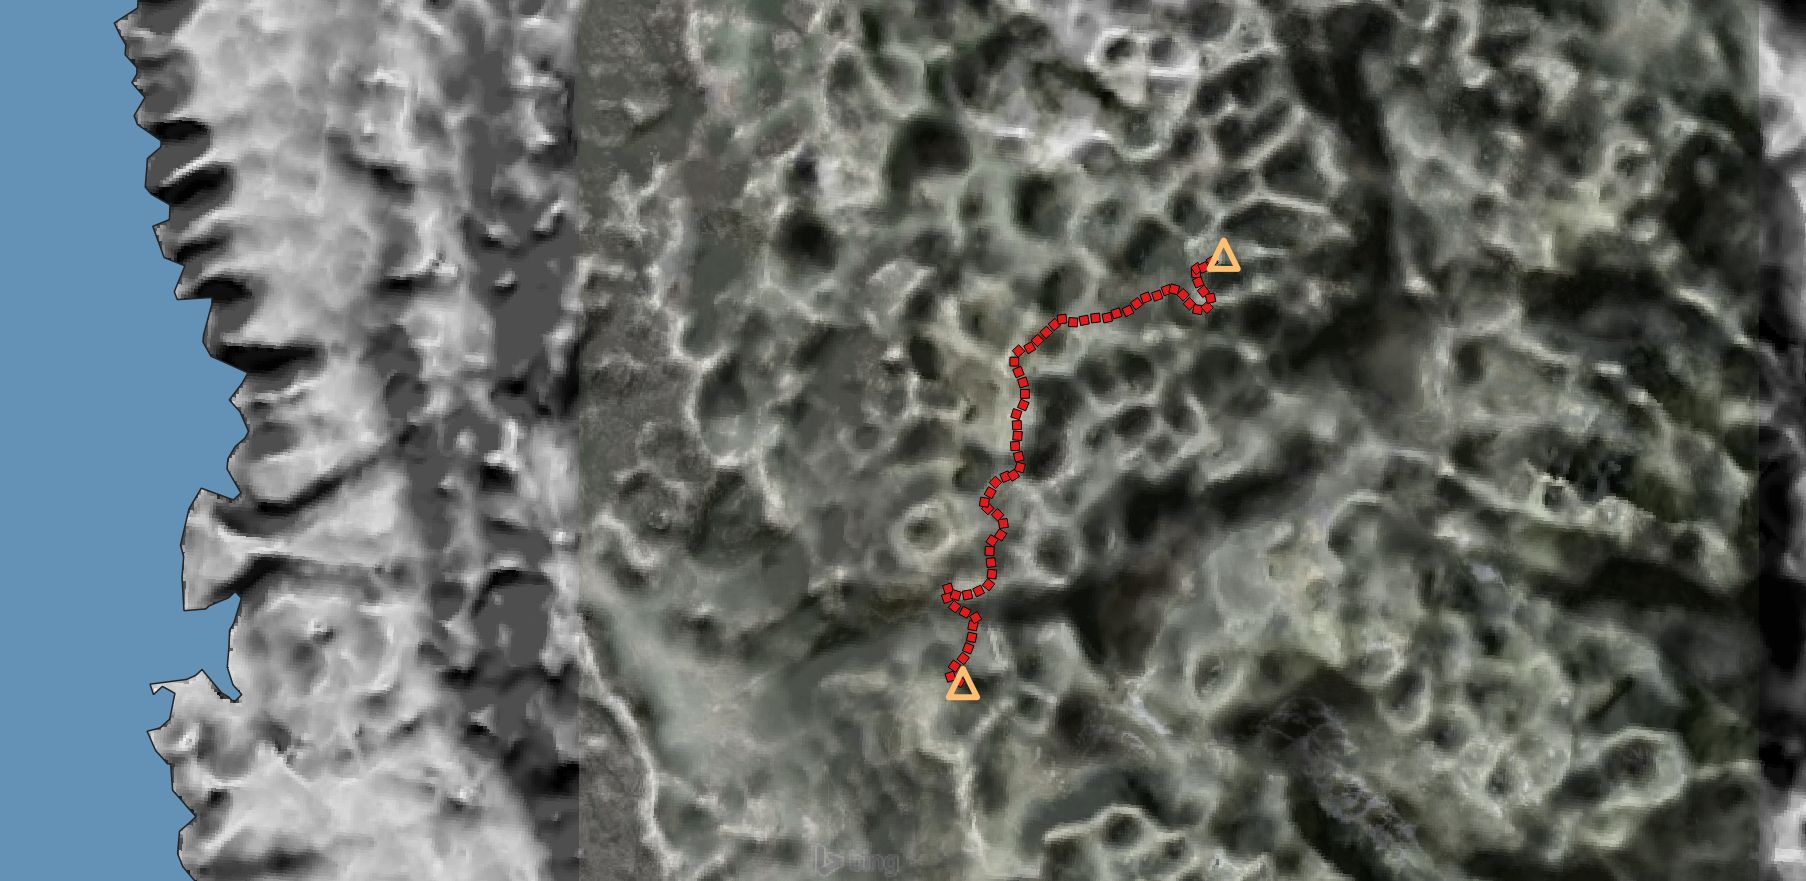
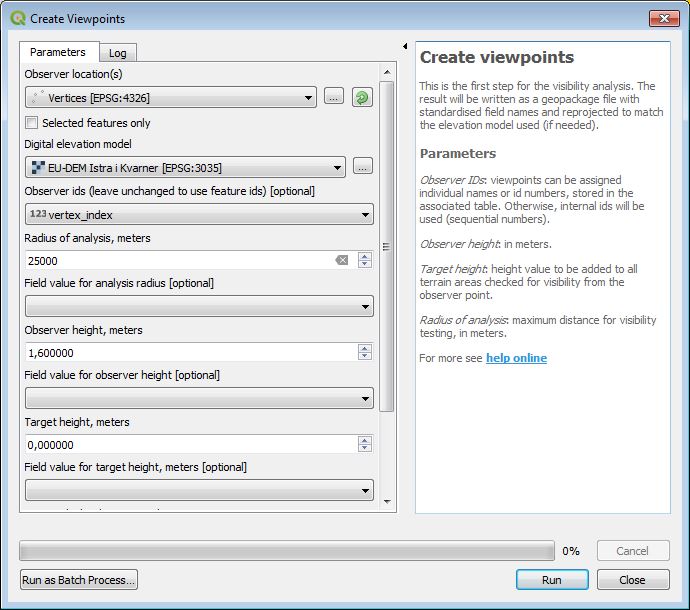
Let’s answer the following question: what scenery does a hiker see while walking along the path? Obviously, he/she cannot see behind his/her back, so we need to restrict the viewing range, let’s say to 45 degrees on each side. Since we’re interested in the overall scenery, we will exclude the immediate zone up to one kilometre distance. The overall analysis radius will be 25 kilometres, to test for far reaching views.
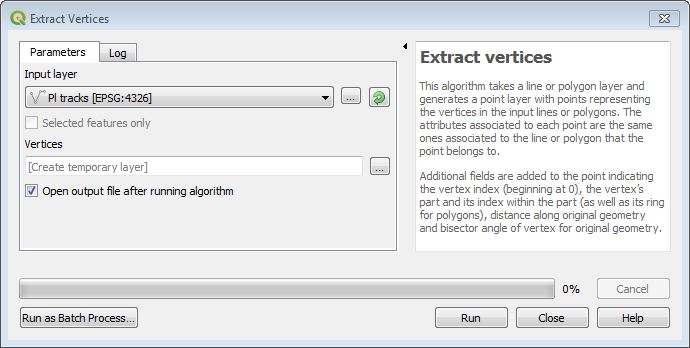
We start with a line drawn along the path. Find the “Extract vertices” algorithm and use it to transform the path into points.
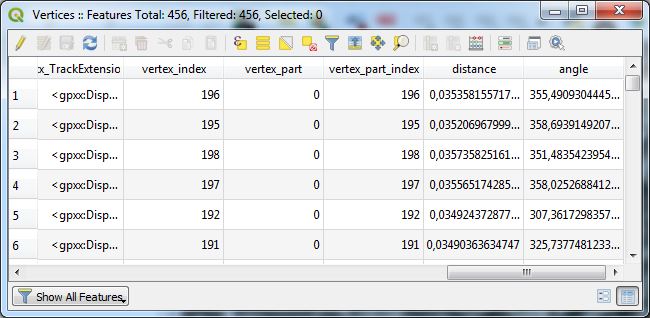
Take a look at the data table of the new file. We have line direction (angle), distance and an ID number for each vertex (yay, all in one step!).
Now, create observer points for the viewshed analysis using desired parameters. Use vertex_index as feature ID.
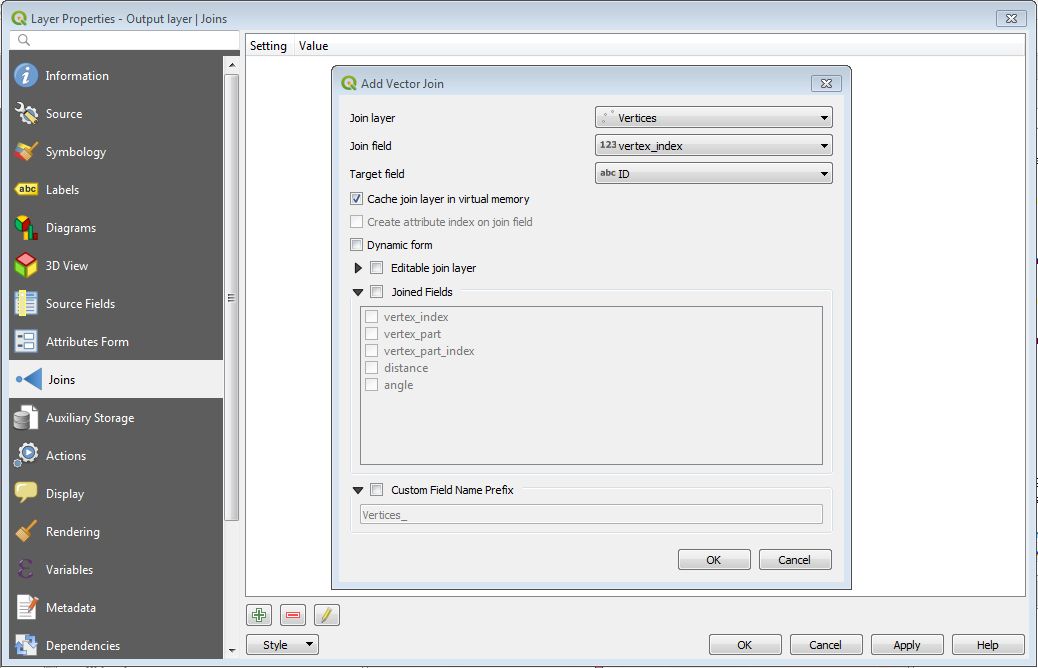
The observer file does not contain the azimuth data: we have to create a data join with the previous file.
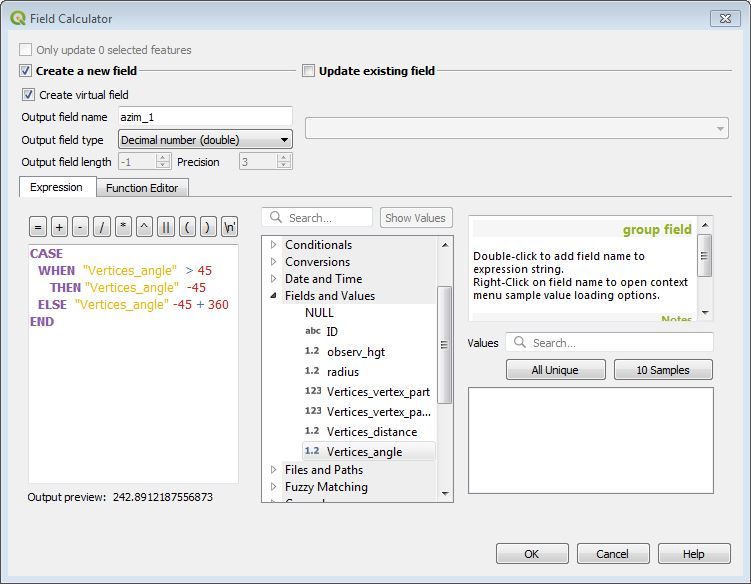
We will now calculate our azimuths and store the parameter in table fields named azim_1 and azim_2. My formula for azim_1 is as following, considering a 90° view range:
CASE
  WHEN "Vertices_angle" > 45
     THEN "Vertices_angle" - 45
  ELSE  "Vertices_angle" - 45 + 360
END
And for azim_2 field:
CASE
  WHEN "Vertices_angle" < 315
    THEN "Vertices_angle" + 45
  ELSE  "Vertices_angle" + 45 - 360
END
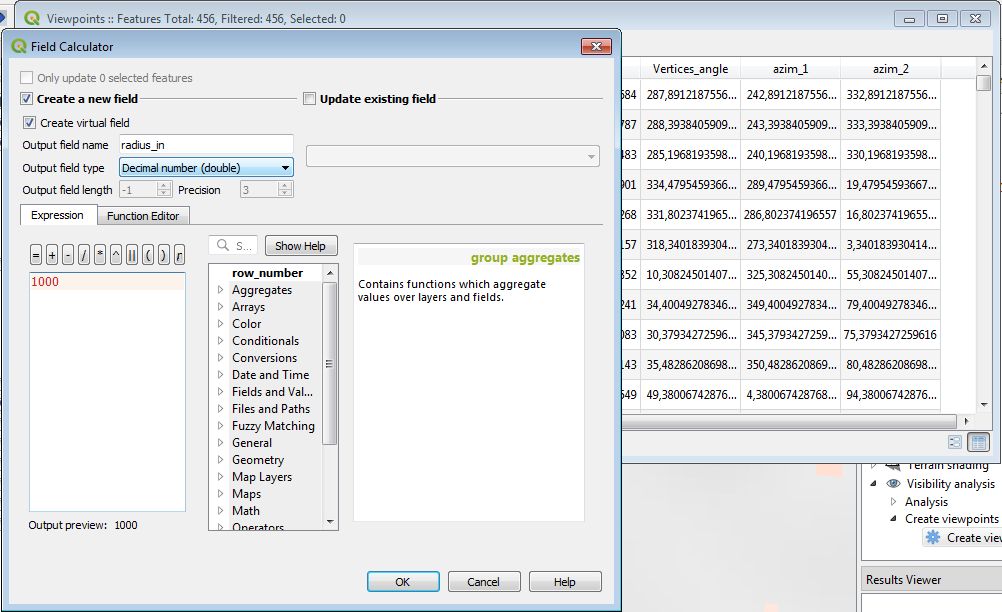
If needed, you can also specify the inner radius in the radius_in filed. Here, it will be 1000 meters.
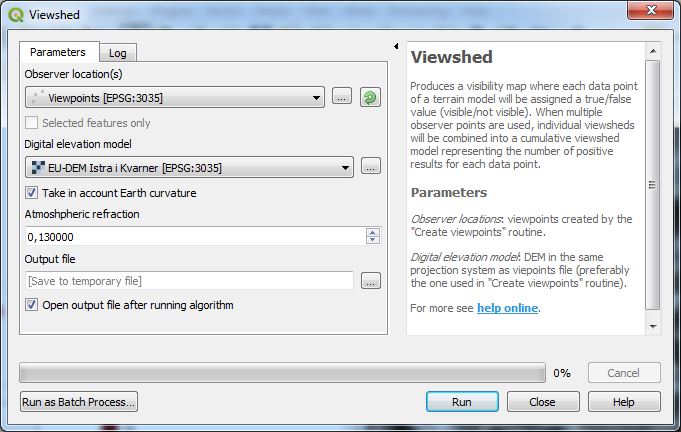
Now, we can finally run the viewshed analysis. All vital parameters have been entered into Viewpoints data table, we just choose file input/output. (25 kilometres is a fairly large radius, the calculation may take a couple of minutes.)
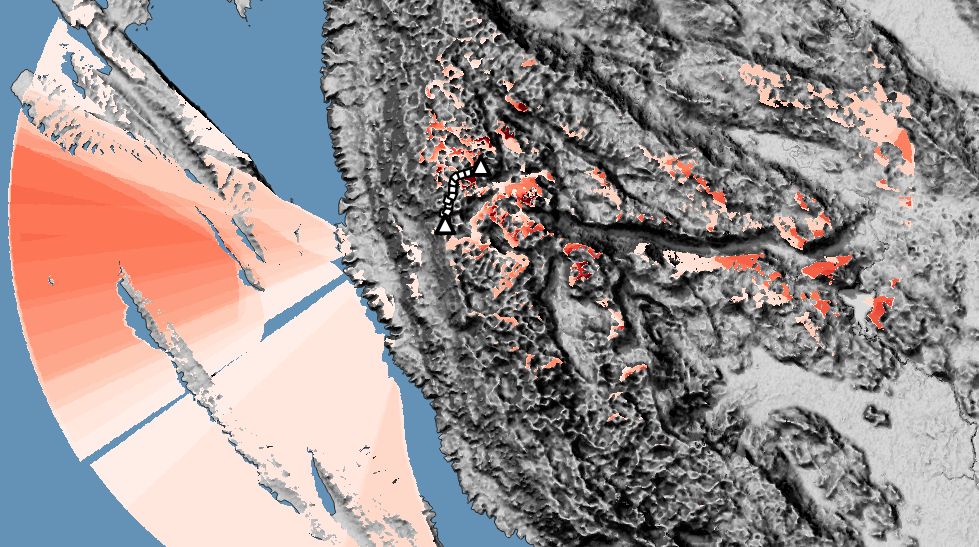
We have, now, a model of directed cumulative viewshed which reveals the areas most often seen by a hiker taking the Premužić trail.
But wait, what happens when he/she goes back? Well, we simply readjust our azim_1 and azim_2 parameters to point in the opposite direction. (I’m leaving you the pleasure of figuring out the calculation. Or, you can use “Reverse line direction” in QGIS and repeat all the steps, if you’re lazy… )
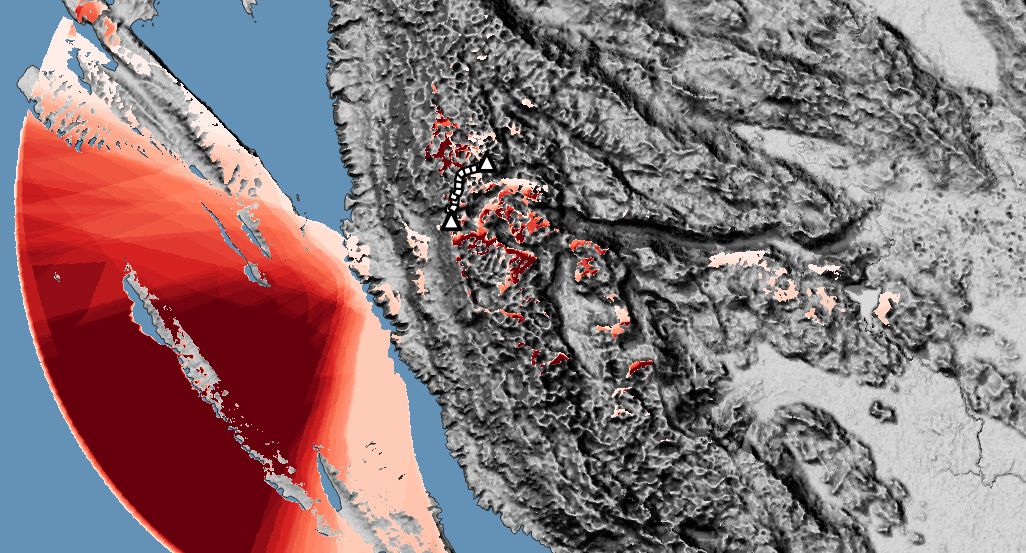
Here is our return viewshed model. Apparently, it is more oriented towards the sea than the previous one.
Happy mapping!