Topographic position index (TPI) is a method of terrain classification where the altitude of each data point is evaluated against its neighbourhood. If a point is higher than its surroundings, the index will be positive, as for example on ridges and hilltops, while the figure will be negative for sunken features such as valleys. Note that the TPI is the same thing as the (simple) local relief model or (S)LRM (depending on what people define as “simple”). The RVT software, widely used for terrain visualisation, is using the SLRM term (Kokalj et al. 2019).

Terrain position index (concavities are in blue and convexities in red). These are animal tracks and some human paths on a Lidar derived DEM.
TPI functions as an average filter where each cell is assigned the average value of its neighbourhood. The method relies on a moving window or kernel which gathers information on such neighbourhood. More specifically, the TPI is calculated by subtracting the average neighbourhhod height from the height of the central cell. Positive values will thus indicate elevated positions, while negative values will map depressions.
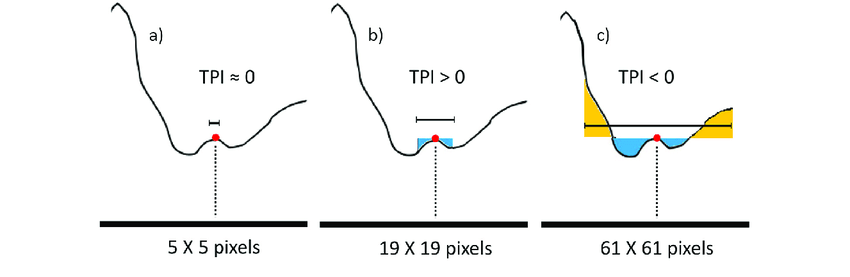
The size of the examined neighbourhood matters: at one scale a site may be seen as situated in a large valley, while at another, more restricted scale, it may appear as occupying flat terrain or even elevated relief (Figure below). Weiss (2001) has proposed a complex terrain classification based on height difference and distance at which such difference may appear or change (hilltop, incised valley, broad valley etc.).
Topographic position index depends on neighbourhood size (Salinas-Melgoza et al. 2018, Fig. 2)
Now, a kernel filter can do more than just gather values, it can also assign them specific weights. This is particularly useful for correcting the common distance issue of the square moving window. Corner cells are situated farther away from the central cell in comparison to cells in orthogonal directions, which means that for the same slope gradient they will signal higher height difference. We can, then correct their values for such distance difference.
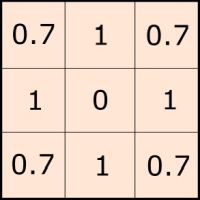
Standard kernel with distance correction
Building on this insight, I’ve implemented a unique set of TPI methods for QGIS Terrain Shading plugin, methods that are unlike any other out there. Filter weights are used here to select parts of the neighbourhood that may be more/less interesting for a specific purpose. We can use the distance from the central cell as weight, an thereby give more importance to the window periphery (distance weighted filter). In that case, for a value v of a neighbourhood cell, the second neighbour will score v*2, the third v*3, and so on.
A common problem to TPI / LRM methods is the tendency to produce a blurred output. This is indeed expected since the average filter is also known as smoothing filter in the domain of image analysis. In order to overcome the problem, the QGIS Terrain Shading plugin provides the inverse distance weighted filter, which puts more stress to the local cell neighbourhood. It will thus apply v*1/2, v*1/3 and so on as we move away from the central point.
The plugin also features the height weighted filter which uses height differences as weights (which amounts to multiplying each height difference by itself). This is a useful enhancement method, for instance when analysing Lidar derived models.
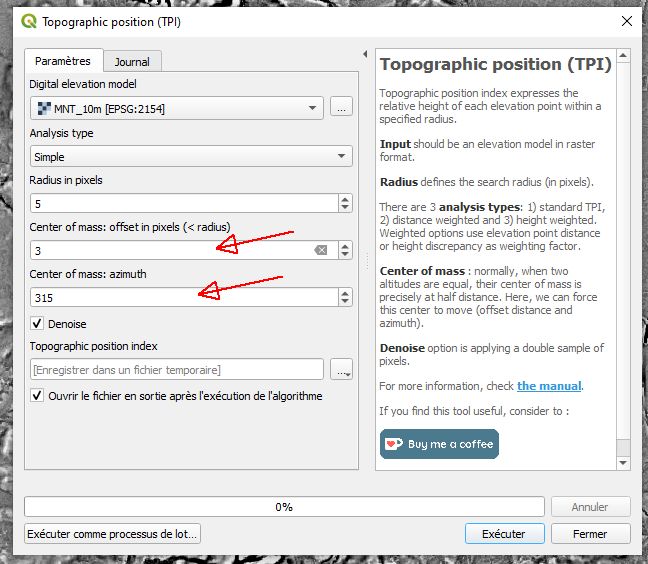
Eccentric TPI filter setting
We can go even further and mess completely with the kernel by introducing asymmetric weights. Observe the kernel below: its balance point or center of mass is not in the central cell, but rather to the south-east. This will give more importance to the terrain at this side, rendering slopes more vividly than in the north-west corner. Why would one do that? As we can see below, the eccentric TPI results in a soft hillshading effect, which can be tweaked with various parameters for window size, shape and weights. In QGIS Terrain Shading module we can specify distance and direction of the center of mass.
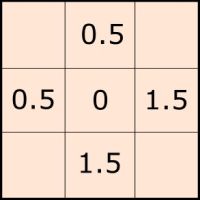
Eccentric filter: the balance point of weights is located southeast of the central cell
These braided channels are difficult to visualise using standard hillshade technique, eccentric TPI may be a better choice (Jackson Hole, Wyoming, USA; data from shadedrelief.com)
Ressources
Kernel processing on Wikipedia
J. Jeness (2006): Topographic Position Index (TPI) v. 1.2.
Kokalj, Ž., Somrak, M. (2019). Why Not a Single Image? Combining Visualizations to Facilitate Fieldwork and On-Screen Mapping. Remote Sensing 11(7): 747.
M. A. Salinas-Melgoza, M. Skutsch, and J. C. Lovett (2018): Predicting aboveground forest biomass with topographic variables in human-impacted tropical dry forest landscapes. Ecosphere 9(1):e02063. 10.1002/ecs2.2063.
Weiss, A. (2001) : Topographic Position and Landforms Analysis, Poster Presentation, ESRI Users Conference, San Diego, CA