[This is the author’s version of an article published in The Oxford Handbook of Archaeological Network Research. This version retains the Box 1 – a really cool example of visual signalling in ancient Mesopotamia. The restricted space in the published volume demanded some sacrifices.]
Abstract
Visibility networks are models of explicit visual relationships between one or more observers and their visual targets. Such networks, comprising visual connections, are analyzed by archaeologists in order to study past signaling and distance communication, land and sea navigation, human experience of architecture, and other problems in landscape archaeology and architectural analysis. This chapter aims to give a broad overview of the topic by introducing basic concepts of visibility analysis, and by reviewing common approaches in visibility network modeling. These approaches are grouped under several general themes: local neighborhood analysis, visual signaling models, network models of human landscape experience, and landscape visibility graphs. Finally, common issues and pitfalls are briefly discussed, such as data quality, historical reality of visibility networks, and the problem of ocularcentrism in visibility analysis.
Keywords
landscape archaeology, visibility networks, intervisibility, visual signaling, visual experience
Introduction
In a sense, vision is all about relationships; directing the gaze toward a person, an object or a living being is normally a means of establishing a connection. At its most basic, such connection amounts to a simple assessment of position and distance of the visual target, but more generally vision situates individuals in the inhabited world. Visibility network modeling is an approach in visibility analysis which aims to model explicit visual relationships between one or more observers and their visual targets. Note that such an approach implies an intentional gaze: a human observer who is seeking to obtain visual connection with specific points of interest in their surroundings. From that point of view, a web of visual connections is a model of intentional social and environmental relationships. This can be contrasted with approaches that were developed for the analysis of general visual properties of (human) landscapes, namely field of view or viewshed modeling (Figure 1; Conolly and Lake 2006: Ch. 10). Unlike visibility networks, field of view models are not necessarily target dependent; their purpose is to account for all visual relationships that comprise a specific scene.
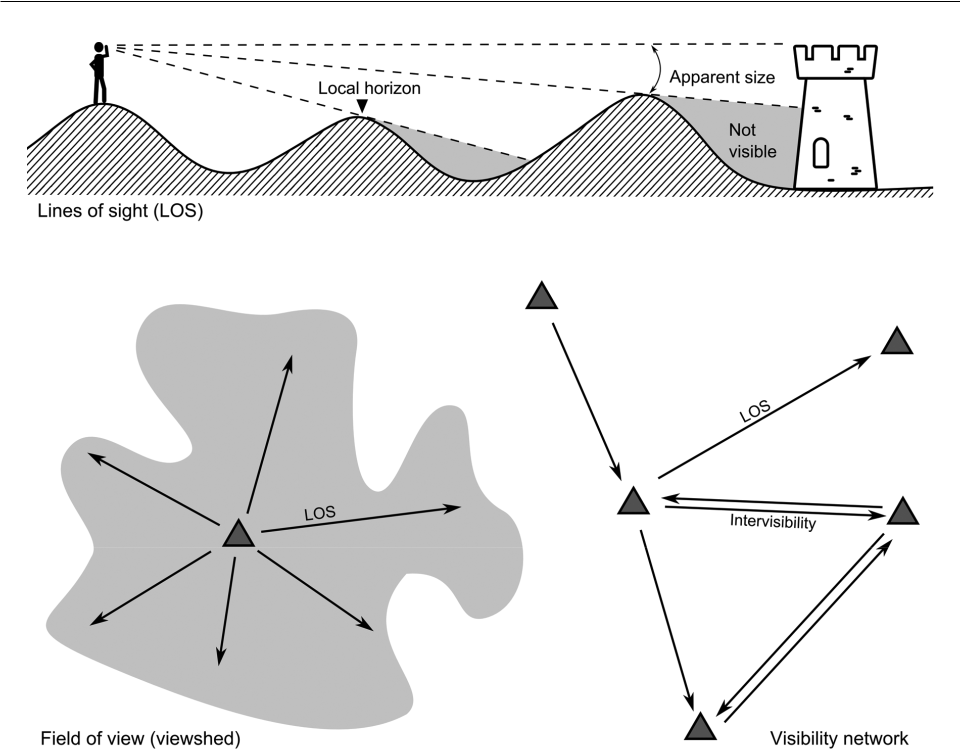
More formally, visibility networks can be defined as models of such visual relationships where both the observer and the visual target are represented as discrete entities. For simplicity these relationships are commonly expressed as a binary state, visible/not visible, but it should be noted that various variables could be taken into account to qualify visual connections, such as view distance or view angle (looking up or down). A visual connection can therefore have its specific strength or relevance, which can be represented as weights in a network model (Brughmans and Brandes 2017). Intervisibility networks are a specific family of visibility networks where each observer is in their turn a visual target, and where each visual connection is bilateral, enabling an exchange of signals in two directions.
Visibility network models can address a varied array of topics, especially those that fall into the domains of landscape archaeology and architectural analysis. Archaeologists have paid much attention to potential communication networks maintained through visual signaling, but visibility analysis can also provide information on human experiences of the surrounding landscape, built or natural. Tilley (1994), for instance, used a network model of visual connections between prehistoric burial mounds to assess the rhythm at which different structures would appear in, and vanish from, the field of view of a theoretical prehistoric observer. Visibility networks also feature prominently in the space syntax approach, which is concerned with human navigation and interaction in architectural spaces (see Wu, this volume Chapter 14).
Box 1 : Fire signals in ancient Mesopotamia
The archive of cuneiform tables of the palace in Mari, on the bank of Euphrates, bears some
of the earliest evidence of distance communication through fire signalling. Reports sent to
king Zimrî-Lîm, ruling in the 18 th c. BC, make explicit descriptions of the use of such signals in
military campaigns fought against the tribe of Benjaminites.
“To my Lord (…). All Benjaminites rose their torches. From Samânum to Illum-Muluk, from
Illum-Muluk to Mišlan, all cities of the Benjaminites in the area of Terqa rose torches to
reply.” King’s troops also use fire signals, as mentioned by one officer: “The Benjaminites
continue to revolt to the point that I was obliged, in all urgency, to raise fires for rescue
troops.” It seems that at one point the need for a code system had emerged: “… previously,
the order was given to raise (a fire) when I see a fire. Now, however, as my lord has written
me, when I see one fire I will not raise the slightest fire; when I see two fires, I will assemble
the (people of the) area, and I will raise two fires.” Fire signals were used for non-military
purposes as well. An official prepares a voyage for the king: “If I do not arrive in Sagaratim,
the first day of my absence raise a fire (in Sagaratim) so that the king would depart.”
All excerpts after G. Dossin (1938).
Visibility Analysis: An Introduction
Algorithms
Technically, a visual connection between two points in space is determined by calculating the path of a light ray and examining for possible obstructions along its path (Fisher 2008). Considering natural landscapes, this can be achieved by using a detailed topographic map that features contour lines, and applying some basic trigonometry. Field observations can also be made, but in that case present-day vegetation or constructions can seriously impede the assessment of potential visual connections. Today, however, visibility analysis is most commonly made with digital tools, using various algorithms integrated into GIS software (Conolly and Lake 2006). Software for digital 3D modeling is also used for detailed visibility analysis at the architectural scale (Paliou 2013).
Ideally, dedicated algorithms for single line of sight modeling should be used, but visibility relationships can also be deduced from the overlap pattern between multiple fields of view (viewsheds). The quality of the resulting visibility models is mostly determined by the quality of terrain or surface models used, notwithstanding problems of archaeological data quality. Terrain models that represent bare earth, stripped of vegetation cover and of architecture, are most commonly used in archaeology. Full environmental reconstruction is rarely possible for (pre)historic periods, unless we resort to “digital gardening”, the hypothetical reconstruction of vegetation cover (Gearey and Chapman 2006).
Determining Visibility
Most commonly, visibility models are made for human observers and in that case should take into account parameters of human visual perception. Visual acuity is measured as an angle occupied by an object of interest in the field of vision and it reaches approximately one arc minute (1′) under laboratory conditions (Schiffman 1976:197). Outdoor spaces, however, rarely offer such ideal conditions (Malm 2016; Antrop and Van Eetvelde 2017). Without delving into detail, some common problems are the contrast between visual target and its background (Shang and Bishop 2000), and differences in perception of moving and static objects (Fábrega-Álvarez and Parcero-Oubiña 2019).
Quite often, a portion of the visible target is obscured by topography and surface features (Figure 1). The visibility algorithm used should provide information on such apparent target height, expressed in angular units. For instance, the 5 top meters of a tower may be sufficient for it to be perceived at up to 5 kilometers distance, where its angular size amounts to 3.4 arc minutes. A more complex method is to verify the size or even the shape of the seen surface, which can be achieved by covering the visual target with a large number of target points, each tested with an individual line of sight. Brughmans and Brandes (2017) propose to use that approach to evaluate the strength (weight) of a visual connection, which is derived from the number of positive lines of sight between an observer and their visual target. Other more complex parameters for modeling human landscape perception have been proposed by psychologists, geographers, and landscape architects (e.g. Higuchi 1983; Gibson 1986; Antrop and Van Eetvelde 2017). However, these parameters are rarely integrated in archaeological visibility network models, perhaps because the problems of general visual experience is more commonly assessed using the field of view (viewshed) approach (Llobera 2003; Ogburn 2006; Brughmans et al. 2018).
Reciprocity and Intervisibility
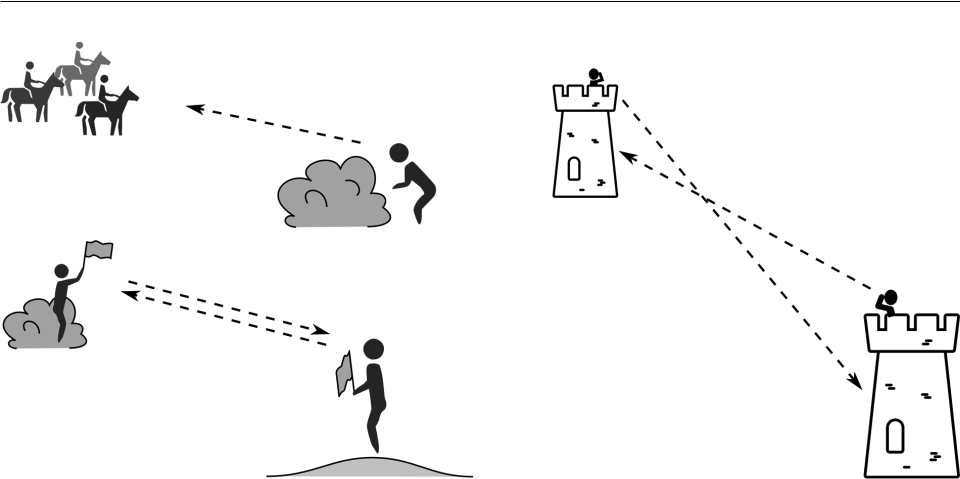
Reciprocity of visual connections is a problem particularly germane to intervisibility models. In these models, each observer is also a visual target, which allows for two-way communication (Figure 2). Such reciprocity can be guaranteed only at very close distance where one cannot escape the gaze of others. At the landscape scale, however, visual relationships are often asymmetrical, especially beyond distances where the human figure can be clearly distinguished. Some persons may be particularly exposed, as when seated in a tower, while others, on the contrary, may be seeking discretion.
Technical or methodological literature, and especially software, that proposes visibility calculations, may be confusing on this point as they often refer to “intervisibility” algorithms when dealing with single line of sight calculation. Mathematically, a line of sight is valid in both directions, a light ray would follow the same path if we were to switch the observer and target points, which makes them theoretically intervisible (cf. Fisher 2008). However, a single ray of light is not sufficient for human perception which requires a beam of rays of certain intensity and diameter; the effective intervisibility has to be modeled following parameters of human visual perception.
Intervisibility models are usually represented as non-directed networks (Swanson 2003; De Montis and Caschili 2012; Brughmans et al. 2014; Čučković 2015). However, such representations assume that all connections are not only reciprocal, but also symmetrical, as it doesn’t account for potential differences in visual exposure within any pair of intervisible locations. That is an important simplification of real-world situations (cf. the problem of the apparent size, as mentioned). Unbalanced visual relationships can be represented with directed networks, although such models are technically more demanding and have seen less use than undirected ones.
It has to be stressed that the issue of reciprocal relationships is more than a technical problem. While human vision certainly has its limits, which can be approximated by a simple threshold value, the questions that archaeologists pose are general in nature and they address complex social relationships. Take for example a visual connection between two islands. For the purpose of navigation, it may suffice that islands appear as faint shapes on the horizon to each other, but if visual signaling is hypothesized, both places should be clearly visible for most of the time. Researcher need to be explicit about which model of social interaction they are interested in and specify the qualities of visual connections that could have been used to maintain or to produce such relationships.
Network Models and Analyses
The analysis of visibility networks should not be confused with the analysis of abstract, graph-theoretical representations of visual connections. A model of visual connections within a specific geographical or architectural space is not a “dataset” to serve as fodder for purely mathematical analysis, but rather a representation of real world situations and relationships. As such, visibility models are always built upon a series of assumptions and in view of a specific set of hypotheses to be examined. Therefore, there can be no single visibility network for a given archaeological dataset, but rather a series of visibility network models, each parametrized according to a specific research hypothesis.
Table 1 : Basic categories of visibility network models.
Global scale | Local scale | |
Information exchange | ● Signaling networks | ● Local neighborhood
|
No information exchange | ● Experiential networks ● Landscape visibility graphs |
On a general level, visibility network models can be characterized according to two criteria, the examined geographical scale and the assumption of information flow across the network (Table 1). As already discussed, vision is always spatial and much affected by distance, whether that be on the geographical scale of a landscape, or on the scale of an individual perceptual envelope when dealing with narrow, architectural space. Things seen close by are rarely of the same importance as those seen far away. Likewise, distant connections within a hypothesized visual communication network, passing through a number of intermediaries, may be more problematic than those that are nearby and requiring only a couple of intermediary transmitters. A researcher is thus presented with a choice between a local approach, where each node is analyzed within its restricted neighborhood, and a global approach that examines nodes in relation with the entirety of the network.
While vision is a means of establishing connections, it is not necessarily a means of interconnecting: visibility networks may or may not be modeled to analyze the transmission of information between people. For instance, a network created for an analysis of the visual experience of a landscape, structured by views of natural or human-made landmarks, does not assume any exchange of information along lines of sight. A string of fire beacons, on the other hand, may be examined through a model of a two-way signaling network, using metrics for information flow.
Local Scale Analysis
The analysis on the local scale is focused on the immediate neighborhood either of each observer, or of each target. Perhaps the simplest approach is to examine the set of connections per node: its local neighborhood. The number of such connections amounts to a node’s degree index. Since a visibility analysis is normally made within a fixed radius around each observer point, it is relatively straightforward to obtain information on target points that fall within the radius but cannot be seen. These two values—successful links and unsuccessful links—can be compared, in order to evaluate the connection success of each node (Figure 3; Čučković 2015). Geographical positions of target points can be further taken into account to examine average distances or azimuths of visual links.
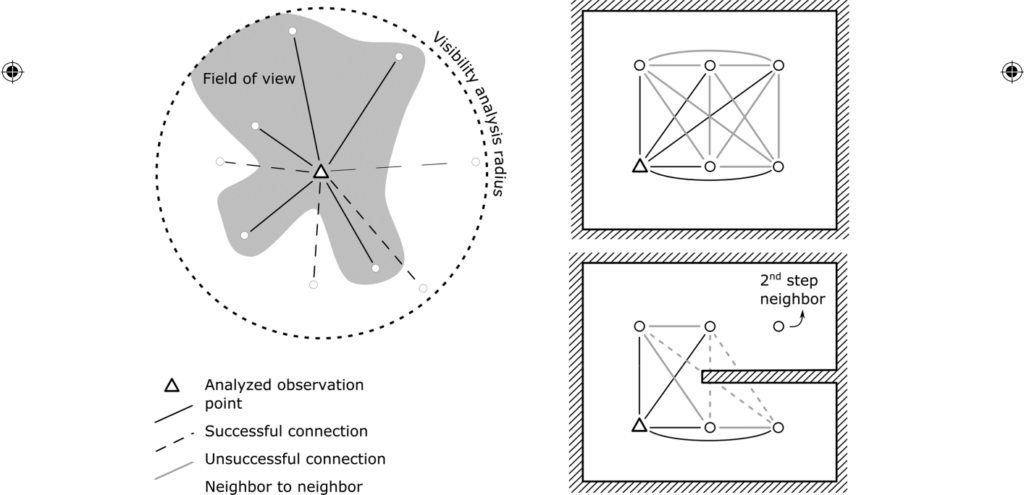
A more sophisticated approach would harness methods developed for so-called ego-networks. These models are centered on individual nodes and take into account both the local neighborhood and the connections between the neighbors, also termed alters (see glossary: ego-network). If the ego-network can be defined as a subset of a larger network where nodes are chosen according to network distance from a specific point (by including neighbors of my neighbor, and so on), in the case of visibility networks, the geographical distance could equally be taken into account. Turner et al. (2001), for instance, analyze local changes in visual experience of a mobile observer within an architectural space (Figure 3, right). A scene will remain similar upon a move toward locations that have the same visual connections as the departing point; the degree of such similarity is quantified through the measure of local clustering coefficient (see glossary: clustering coefficient, and Fillet and Rossi, this volume Chapter 2).
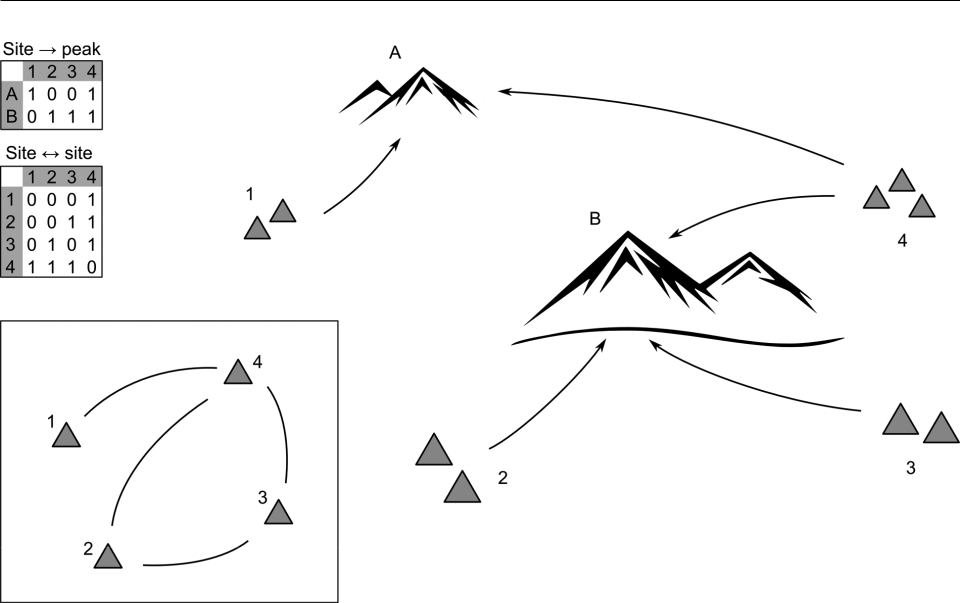
Local, “egocentric” approaches are particularly interesting for fine-grained analysis of the cultural landscape surrounding individual archaeological sites. Bernardini and Peeples (2015), for example, analyzed the visual connections between the Ancestral Pueblo settlements (southwest United States) and prominent mountain peaks. These “visual anchors” would have fostered a common sense of belonging to communities that shared similar vistas (Figure 5).
Visual Signaling Networks
Communication networks, through visual signaling in particular, have received the bulk of the attention in archaeological research, even if they have proven to be rather elusive (Figure 4). Material traces of signaling outposts are rarely found, although some particular cases were reported, such as a series of small hilltop platforms recorded in Chihuahua region, Mexico, and dated to 13th to 15th century ce (Swanson 2003). Elsewhere, visual communication or at least a need for such communication is deduced from the character of archaeological sites and from their topographic setting. Some kind of mutual alarm system would add greatly to the defensive function of sites such as prehistoric hillforts, medieval castles, or military outposts, especially for sites enjoying good visual access to their surroundings (Dular and Tecco-Hvala 2007; De Montis and Caschili 2012; Earley-Spadoni 2015; Brughmans and Brandes 2017).
Visual communication networks appear as ideal candidates for classical network analysis, concerned with global network properties such as resilience, integration, and conductivity for information flow. Standard indices of node centrality, betweenness in particular, can be used to isolate potential relay points for hypothesized signal transmission along the network (De Montis and Caschili 2012; Čučković 2015). Fraser (1980) introduced the cutpoint index in the study of archaeological intervisibility networks, which expresses, for each node, the number of otherwise isolated components that the node keeps connected. Nodes that can safely be removed, without network break-up, have a cutpoint value of one. A robust network should minimize the number of vulnerable points by keeping alternative connections; such connection redundancy has indeed been reported for archaeological cases (Swanson 2003; Earley-Spadoni 2015; Zhu et al. 2017).
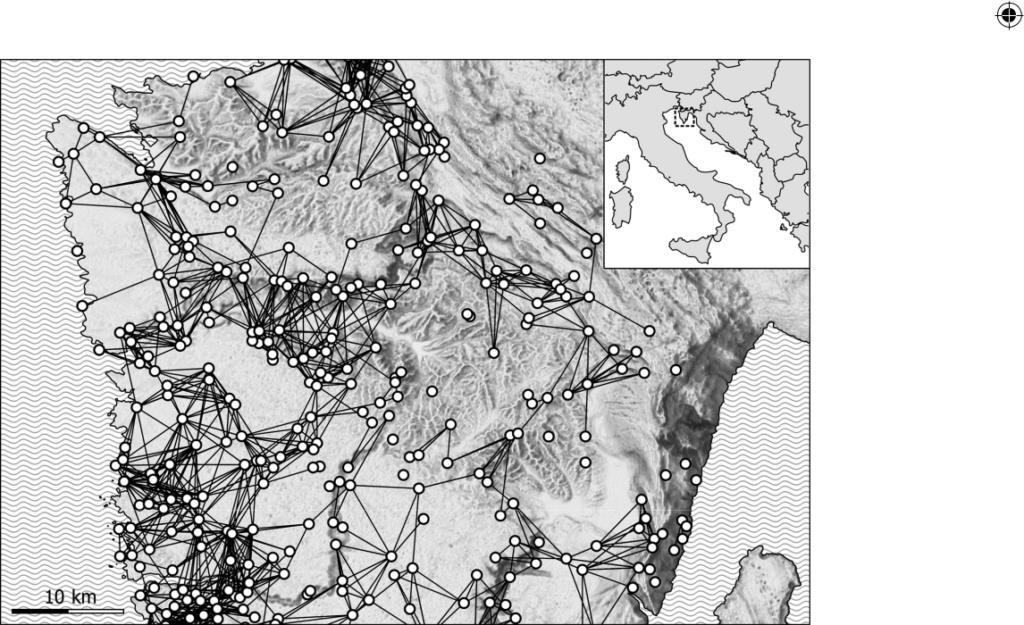
Considering strategic advantages offered by visual signaling, as well as historical examples which converge on its main military or otherwise defensive purpose, archaeologists have paid close attention to the potential of signaling networks for territorial control and organization (Dular and Tecco-Hvala 2007; Ruestes 2008). The existence of specific intervisibility hubs that maintain a disproportionately high number of visual connections may be interpreted in terms of centralization of signal transmission, especially if such hubs bear traces of particular built structures, such as the probable signaling beacons reported by Swanson (2003). In some cases, such organization may be related to a system of centralized territorial control, emanating from a small number of high status sites, but in general the configuration of an intervisibility network should not be confused with the web of political contacts and dependencies. Bigger, high rank settlements tend to be localized in lower positions and may sometimes enjoy very mediocre visual control. An analysis of Bronze Age hillforts on the coast of the Adriatic Sea revealed very poor connectivity of one major settlement, while sites that could have functioned as major hubs within the intervisibility network appear as smaller, less important settlements (Čučković 2015).
In the absence of archaeologically detectable traces of beacons or other installations for visual signaling, a major challenge for archaeological analysis is to ascertain the historical relevance of hypothetical communication exchange. A common approach is to explore structural properties of an intervisibility network; relying on insights of general network theoretical research, overall configurations such as the small-world model (see glossary: small-world network) or “scale-free”, hub-and-spokes model (see glossary: power-law) may be interpreted in light of specific mode of functioning. De Montis and Caschili (2012), for instance, reported a high clustering coefficient for an intervisibility network between Bronze Age towers in Sardinia (the nuraghi), and classified the model as a small-world network. Such configuration would indicate that Sardinian towers “were systematically located in order to favor social relationships among groups of ancient inhabitants” (De Montis and Caschili (2012:322).
However, general network theory cannot provide deeper insights into the evolution or functioning of visibility networks. More often than not, a variety of historical trajectories could have resulted in a specific network configuration. A more sophisticated approach was proposed by Brughmans et al. (2014, 2015), who deployed exponential random graph modeling (ERGM; see Amati, this volume Chapter 19) to analyze processes which gave rise to an intervisibility network connecting Iberian Iron Age hillforts. The researchers hypothesized that specific functions of intervisibility networks and specific processes of their evolution would have favored the creation of particular atomic configurations, such as strings of mutually visible nodes for signal transmission, or star-shaped patterns for visual control from a dominant settlement hub. A series of such hypothesized patterns was then introduced in otherwise random network models, which were then compared with the observed, archaeological network. The best-fit model was the one biased toward star-shaped configurations where a fewer number of settlements would maintain a disproportionately high number of connections. Based on this finding, Brughmans et al. (2014:452) proposed that the visibility network of Iberian hillforts developed out of the need for local visual control from higher rank settlements, rather than for long distance signal transmission.
Finally, a classical approach for testing the hypothesis that an intervisibility network was formed to satisfy needs for communication exchange is to evaluate the observed network against the visual structure of the landscape. In theory, such a communication network would take the best advantage of landscape visual structure, for instance by choosing visually exposed locations for relay sites. Several authors tackled the problem by comparing the observed network with one or more random networks, generated for a sample of potential signaling points, usually topographic prominences (Swanson 2003; Earley-Spadoni 2015; Mullins 2016). A more comprehensive variant of that approach is to model the complete intervisibility network for all potential signaling locations and then to compare the observed archaeological configuration against such a pool of possible solutions (Čučković 2015). Relatively simple to carry out, these approaches may only attest to the relevance of a specific configuration, namely through comparison with a theoretically random pattern, but they do not provide information on its functions and historical development.
Network Models of Visual Experience
Experiential visibility networks are a significantly different family of visibility models. Rather than studying information exchange, these models examine the overall structure of human visual experience, more specifically connections with chosen points of interest (landmarks, monuments, natural features etc.). Criado Boado and Villoch Vázquez (2000), for instance, synthesized the experience of movement through a stretch of Neolithic landscape in Galicia (Spain) as a network of connected visual scenes. Peatfield (1994) proposed that intervisibility between Minoan hilltop sanctuaries (island of Crete) would have expressed a “ritual unity that may have transcended political boundaries” (Peatfield 1994:25). Such exploratory, descriptive approaches provide valuable insights and continue to be developed today. Gauthier et al. (2017), for example, analyze the landscape setting of Bronze Age metalwork hoards from the eastern France through their visual connections with contemporaneous settlements, natural features and other neighboring hoards. Even if locations of metalwork hoards may have been unmarked in the prehistoric landscape, areas designated for such practices seem to have been known and recognized, and their visual connections with other culturally significant sites could have added a specific value to possibly ceremonial events of metalwork deposition.
A rare attempt to push such an approach into the domain of graph-theoretical analysis was made by Peeples and Bernardini (2015) for the study of sight communities of the Ancestral Pueblo. These researches hypothesized based on local contemporary ethnographic accounts that shared views of local mountaintops would forge a specific cultural bond between local communities, which would have facilitated cultural contact and exchange. Therefore, shared mountain views were represented as a two-mode network, connecting settlements to mountain peaks, which was transformed into a one-mode network through a routine operation of matrix multiplication (Figure 5; for two-mode networks see Östborn and Gerding, this volume Chapter 5). The result of such an operation is a network of archaeological sites that are connected with each other on the basis of shared views. It remains to be seen, however, to what extent these “sight communities” would map to specific political or cultural entities.
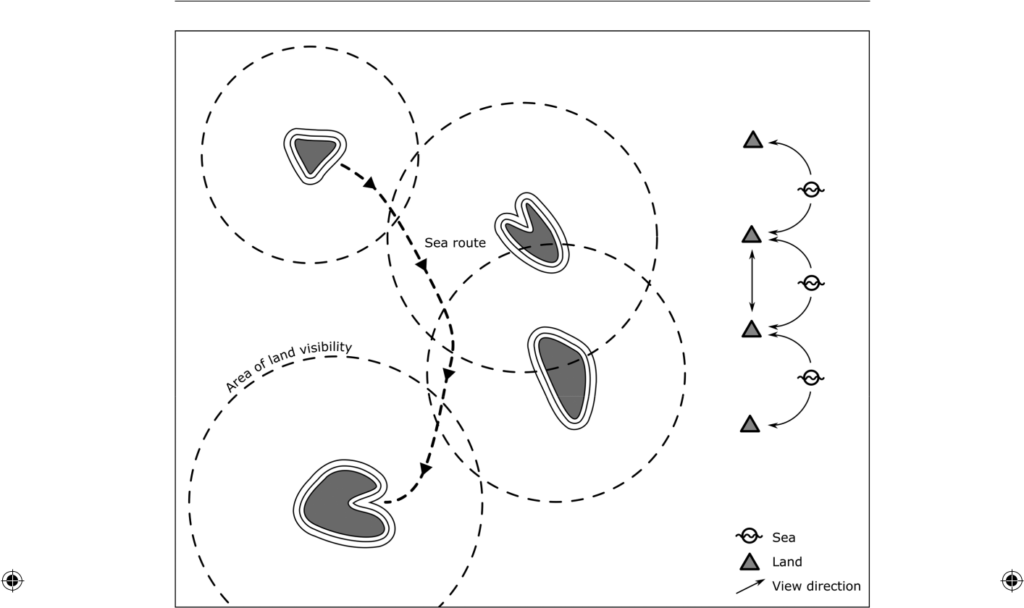
A similar approach is used for the analysis of maritime navigation. Sight of land is an important, if not crucial piece of information for traditional seafaring; it can be assumed that chains of visual connections with the nearest shore were an important feature of premodern maritime routes (Figure 6; see also Torres and Rodríguez Ramos 2008; Brughmans et al. 2018). On the most basic level, two types of such navigational landmarks can be envisaged: those that are already visible from the point of departure (land-to-land visibility) and those which become visible only once at sea, while still keeping visual contact with the departure point or an intermediary landmark. Therefore, navigational visibility networks can be represented as two-mode networks, sea to land, where a minimal requirement for assuming a navigational connection between two land surfaces is the existence of an area from which the two are visible at the same time.
Landscape Visibility Graphs
A specific category of visibility networks is the so-called landscape visibility graph (De Floriani et al. 1994; Turner et al. 2001; O’Sullivan and Turner 2001). These models are used to characterize open spaces, rather than to analyze connections between individual, localized observers, or their discrete visual targets. The observer and target points are distributed as samples of such spaces, usually in a dense grid comprising thousands of points (Figure 7). Such networks can be described as a sample of a total visibility model which is summarizing all possible fields of view within a specific area (Brughmans and Brandes 2017; Brughmans et al. 2018). Indeed, each field of view can be represented as a dense network of radiating visual connections (Figure 1); a landscape visibility graph will retain only those lines of sight that connect sampled observer locations. Such an approach is bridging the gap between spatially continuous field of view models and spatially discrete visibility networks.
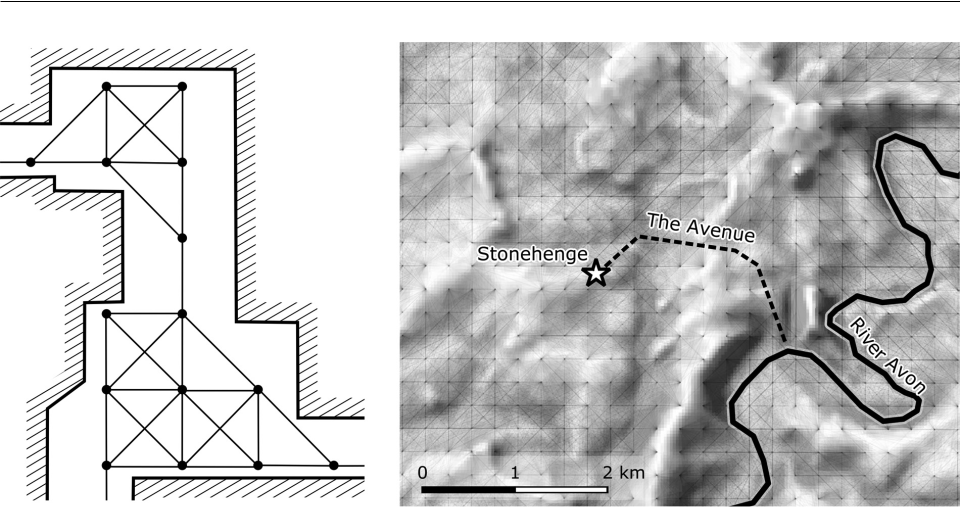
So far, the use of visibility graphs has mainly been restricted to the space syntax methodology, developed for the analysis of architecture and urban or built-up spaces (see Wu, this volume Chapter 14). Large, open spaces facilitate human interaction and navigation, while a cluster of small and fragmented spaces may lead to confusion and disorientation (Hillier 2014). Given the irregular layout of many urban environments, composed of winding streets that morph seamlessly into larger spaces of all shapes and sizes, it is not an easy task to model the rhythm of open spaces and passages that connect them. Visibility analysis has proven to be a useful method for identification of such spaces and passages. Clusters of visually densely connected locations normally map onto such open spaces, termed “convex spaces” in space syntax parlance (Figure 7, left).
Considering natural landscapes, very dense visibility networks can be used to analyze complex problems such as the (mathematically) optimal placement of signaling beacons, the choice of a visually exposed/concealed path, or the optimal location of surveillance outposts. Drawing on the space syntax approach, O’Sullivan and Turner (2001) proposed to use such models to characterize landscape experience: cohesive subgroups or cliques (see glossary: clique) within the network may chart areas where one would feel “some sense of enclosure”, while low local clustering coefficient would be related to areas that feel peripheral and poorly connected. Brughmans and Brandes (2017) suggest the use of landscape visibility graphs in conjunction with total visibility models in order to explore the deeper structure of the visual environment of archaeological sites. Unfortunately, landscape visibility graphs pose significant technical problems (mainly due to being computationally complex to produce) and have attracted limited attention so far; case studies based on the approach remain rare in landscape studies in general.
Some General Issues in Visibility Network Modeling
It has already been stressed that visibility networks should not be conceived of as “data structures” but rather as models of historical or present day social configurations. The analysis of such models cannot be separated from the analysis of social practices such as signaling, navigation, monument construction, or territorial claims. The choice of parameters for visibility modeling should be made according to the hypothesized range of uses to which a web of visual connections may have been put, or according to the range of experiences that it may have induced. For instance, in her analysis of intervisibility relationships between small, warring communities that occupied the Titicaca basin in the 11th to 15th centuries ad, Arkush (2011) limited sight distances to no more than 10 kilometers. According to this model, the Andean communities lived in a world of unstable, shifting alliances and small-scale warfare where one would always prefer to keep an eye on the immediate surroundings.
A related problem pertains to abstract network theoretical indices and metrics which do not translate ideally into indices of specific social practices or processes. Experiential visibility networks pose particular problems in this respect, for instance when analyzed with betweenness centrality. This metric can be used to model information flux though a network, but may not be appropriate for an analysis of landscape visual qualities. Likewise, the conceptual permeability between mathematical and social network models may pose significant problems for the analysis of visibility networks. A good example is the small-world model which describes some common densely connected configurations that arise through social interaction (glossary: small-world network). However, similar properties can be found in naturally occurring patterns of landscape visual connectivity (see Figure 7). For that reason, visibility networks analyzed by archaeologists tend to be densely connected and may feature mathematical properties of small-wold models (high clustering coefficient), but such structural qualities do not necessarily arise out of need to fulfil specific social connectivity needs.
These problems of mapping abstract, mathematical models onto social models for past societies are complicated by the rather ambiguous character of visibility networks: in what form did these configurations exist in the past? Intervisibility networks, sight communities, or maritime routes are all normally envisaged as having genuinely existed in the past, but only exceptionally can such models be based on traces of material infrastructure, such as fire beacons. More often than not, visual communication practices are hypothesized on the basis of structural properties of an archaeological model. However, even when historical relevance of visibility connections may be demonstrated statistically, this does not guarantee the historical existence of a specific infrastructure. A visual corridor for maritime navigation, for instance, is a general landscape feature, an affordance that may have been activated in some but not all historical periods. Rather than treating visibility networks as fully operational infrastructure, archaeologists should consider a range of modes in which visual connectivity could have taken part in past social life. Webs of visual relationships could have been experienced subliminally or on a restricted local basis, as might be the case of sight communities. Or perhaps, the potential for visual connectivity of a landscape may have been recognized by its inhabitants, but rarely put to practical use. Interconnected but not straightforwardly conductive to information flow, a good part of historical visual networks may be better described as meshworks, following Ingold (2007). As such, they are felt as incentive for establishing contact or as stimulus for movement, without imposing a restricted number of communication channels. Such an ethereal quality of visibility networks does not make them unreal; it rather calls for more diverse and more perceptive approaches in addition to rigorous, positivist hypothesis testing.
A problem common to all archaeological modeling is data quality. Rarely can all relevant archaeological remains be known, especially when the analysis covers a larger area. As the number of missing sites cannot be assessed, and even less so their possible topographic positions, most visibility networks modeled by archaeologists are incomplete and biased toward classes of sites that are better preserved. However, a model of potential visual contacts should not be regarded as a reconstruction, a snapshot of a particular historical situation, but rather as a proxy for testing a specific hypothesis. Along with data quality, we should be concerned with model robustness, i.e. the impact of data inconsistencies on network structure and other relevant model properties. Classical network analysis is well equipped in this respect as the issues of network resilience toward progressive removal of nodes or links have been much studied (Newman 2010:Ch. 16; Barthélemy 2011). An attempt to analyze this problem in the context of visibility analysis was made by Llobera (2005). Studying the visual landscape of prehistoric barrows in Yorkshire, England, he established that the removal of up to half of the prehistoric structures would not change radically the overall pattern of their visual impact on prehistoric landscape.
Much has been written on the issue of the “western gaze”, objectifying, dominating, and capitalist (cf. Heidegger 1977; Jay 1988; Foucault 1995). The sense of vision is, on the one hand, particularly treacherous when relied upon to understand the world, and on the other hand, suspiciously cherished by the power. Cartography is an ideal example of such a collusion between the technique of visual representation and techniques of domination: colonial expansion in the eighteenth and nineteenth centuries, and warfare in the twentieth century, were much reliant on cartographic representations (Lacoste 1976). Visibility analysis has been accused of enshrining such occidental ocularcentrism in archaeology by assuming that past societies viewed their world in the same manner as modern, western capitalists (Thomas 2009). Nevertheless, humans as a species have a particularly developed sense of vision and the pertinence of visibility analysis for the study of past or present cultures cannot be discredited on purely theoretical grounds. In fact, visibility networks are a particularly interesting means of confronting these critiques and to take part in the debate on ocularcentrism. Setting aside landscape graphs, models that have been reviewed here are explicitly intentional, they represent an active relationship between an observer and their visual target. From that point of view, visibility networks model a type of discourse, be that through communication exchange, by providing a visual reference to a landmark, or, in the case of monumental constructions, by altering the visual experience of the landscape. Imposing or commending a view on a group of people is a classical ingredient of power statements, and visibility networks can be seen as means of exploring such visual discourse.
Conclusion
Modeling visual relationships and visual experience by means of networks has permitted archaeologists to tackle a diverse range of topics, from ancient long-distance communication to intimate experience of architectural spaces. However, visibility networks are also a tantalizing and rather under-researched topic. From the methodological point of view, much remains to be explored in the domain of complex and large-scale models, in particular directed and weighted visibility networks, as well as landscape visibility graphs. Incorporating elaborate indices of human visual experience, developed for architectural and landscape analysis, is equally a challenge that should be feasible, especially concerning metrics that have already been translated into algorithmic solutions. Conceptually, visibility networks may seem ambiguous for archaeologists used to analyzing artifacts and human-made structures. While they can be modeled as mathematical objects, from a historical point of view the majority of visibility networks studied by archaeologists can be characterized as patterns that existed within past cultural landscapes. Such patterns may emerge as a by-product of human interactions and their relations with the environment and, once acknowledged, as an outcome of occasional enhancements and local adaptations. From this point of view, the fundamental challenge facing visibility network modeling is in bringing these visual patterns into the wider context of past cultural landscapes, i.e. relating them to social and territorial organization, visual culture, land use, and other landscape based practices.
Suggested Reading
Wesley Bernardini and Matthew A. Peeples. 2015. Sight Communities: The Social Significance of Shared Visual Landmarks.
Tom Brughmans and Urlik Brandes. 2017. Visibility Network Patterns and Methods for Studying Visual Relational Phenomena in Archaeology.
Zoran Čučković. 2015. Exploring Intervisibility Networks: A Case Study from Bronze and Iron Age Istria (Croatia and Slovenia).
Leila De Floriani et al. 1994. Line-of-sight Communication on Terrain Models.
Steve Swanson. 2003. Documenting Prehistoric Communication Networks: A Case Study in the Paquimé Polity.
References Cited
Antrop, M., and V. Van Eetvelde. 2017. Landscape Perspectives. The Holistic Nature of Landscape. Landscape Series Vol. 23. Springer Netherlands, Dordrecht.
Arkush, E. N. 2011. Hillforts of the Ancient Andes. Colla Warfare, Society, and Landscape. University Press of Florida, Gainesville; Tallahassee.
Barthélemy, M. 2011. Spatial Networks. Physics Reports 499(1–3):1–101. DOI:10.1016/j.physrep.2010.11.002.
Bernardini, W., and M. A. Peeples. 2015. Sight Communities: The Social Significance of Shared Visual Landmarks. American Antiquity 80(2):215–235. DOI:10.7183/0002-7316.80.2.215.
Brughmans, T., M. de Waal, C. Hofman, and U. Brandes. 2018. Exploring Transformations in Caribbean Indigenous Social Networks Through Visibility Studies: The Case of Late Pre-colonial Landscapes in East Guadeloupe (French West Indies). Journal of Archaeological Method and Theory 25(2):475–519. DOI:10.1007/s10816-017-9344-0.
Brughmans, T., and U. Brandes. 2017. Visibility Network Patterns and Methods for Studying Visual Relational Phenomena in Archaeology. Frontiers in Digital Humanities 4(17). DOI:10.3389/fdigh.2017.00017.
Brughmans, T., M. van Garderen, and M. Gillings. 2018. Introducing Visual Neighbourhood Configurations for Total Viewsheds. Journal of Archaeological Science 96:14–25. DOI:10.1016/j.jas.2018.05.006.
Brughmans, T., S. Keay, and G. Earl. 2014. Introducing Exponential Random Graph Models for Visibility Networks. Journal of Archaeological Science 49:442–454. DOI:10.1016/j.jas.2014.05.027.
Brughmans, T., S. Keay, and G. Earl. 2015. Understanding Inter-settlement Visibility in Iron Age and Roman Southern Spain with Exponential Random Graph Models for Visibility Networks. Journal of Archaeological Method and Theory 22(1):58–143. DOI:10.1007/s10816-014-9231-x.
Conolly, J., and M. Lake. 2006. Geographical Information Systems in Archaeology. Cambridge University Press, Cambridge; New York.
Criado Boado, F., and V. Villoch Vázquez. 2000. Monumentalizing Landscape: From Present Perception to the Past Meaning of Galician Megalithism (North-west Iberian Peninsula). European Journal of Archaeology 3(2):188–216. DOI:10.1177/146195710000300203.
Čučković, Z. 2015. Exploring Intervisibility Networks: A Case Study from Bronze and Iron Age Istria (Croatia and Slovenia). In Proceedings of the 42nd Annual Conference on Computer Applications and Quantitative Methods in Archaeology, edited by F. Giligny, F. Djindjian, L. Costa, P. Moscati, and S. Robert, pp. 469–478. Archaeopress Archaeology, Oxford.
De Floriani, L., P. Marzano, and E. Puppo. 1994. Line-of-sight Communication on Terrain Models. International Journal of Geographical Information Systems 8(4):329–342. DOI:10.1080/02693799408902004.
De Montis, A., and S. Caschili. 2012. Nuraghes and Landscape Planning: Coupling Viewshed with Complex Network Analysis. Landscape and Urban Planning 105(3):315–324. DOI:10.1016/j.landurbplan.2012.01.005.
Dossin, G. 1938. Signaux lumineux au pays de Mari. Revue d’assyriologie et d’archéologie orientale
35(3/4):174–186.
Dular, J., and S. Tecco-Hvala. 2007. South-eastern Slovenia in the Early Iron Age: Settlement, Economy, Society / Jugovzhodna Slovenija v starejši železni dobi: poselitev, gospodarstvo, družba. Opera Instituti Archaeologici Sloveniae 12. Inštitut za arheologijo ZRC SAZU, Založba ZRC, Ljubljana.
Earley-Spadoni, T. 2015. Landscapes of Warfare: Intervisibility Analysis of Early Iron and Urartian Fire Beacon Stations (Armenia). Journal of Archaeological Science: Reports 3:22–30. DOI:10.1016/j.jasrep.2015.05.008.
Fábrega-Álvarez, P., and C. Parcero-Oubiña. 2019. Now You See Me. An Assessment of the Visual Recognition and Control of Individuals in Archaeological Landscapes. Journal of Archaeological Science 104:56–74. DOI:10.1016/j.jas.2019.02.002.
Fisher, Peter. 2008. Intervisibility. In Encyclopedia of Geographic Information Science, edited by K. Kemp, pp. 242–243. SAGE Publications, Thousand Oaks CA. DOI:10.4135/9781412953962.n107
Foucault, M. 1995. Discipline and Punish. The Birth of the Prison. Vintage Books, New York.
Fraser, D. 1980. The Cutpoint Index: A Simple Measure of Point Connectivity. Area 12(4):301–304.
Gauthier, E., J.-F. Piningre, and H. Grut. 2017. Dépôts De Bronzes et Relations Visuelles Autour du Camp du Château à Salins-les-Bains (Jura, France) à la Fin du Bronze Moyen et au Début Du Bronze Final. In Actes du colloque APRAB “Bronze 2014” (Strasbourg, 17–20 juin 2014), edited by T. Lachenal, Cl. Mordant, T. Nicolas, and C. Vébér, pp. 903–914. Mémoires d’Archéologie du Grand-Est 1. Association pour la Valorization de l’Archéologie du Grand Est, Strasbourg.
Gearey, B., and H. Chapman. 2006. “Digital Gardening.” An approach to simulating elements of palaeovegetation and some implications for the interpretation of prehistoric sites and landscapes. In Digital Archaeology: Bridging Method and Theory, edited by T. L. Evans and P. Daly, pp. 154–172. Taylor & Francis Group, London; New York.
Gibson, J. J. 1986. The Ecological Approach to Visual Perception. Lawrence Erlbaum Associates, New Jersey.
Heidegger, M. 1977. The Age of the World Picture. In The Question Concerning Technology and Other Essays, by M. Heidegger, pp. 115–154. Harper Perennial, New York; London.
Higuchi, T. 1983. Visual and Spatial Structure of Landscapes. MIT Press, Cambridge, Massachusetts.
Hillier, B. 2014. Spatial analysis and cultural information: the need for theory as well as method in space syntax analysis. In Spatial Analysis and Social Spaces. Interdisciplinary Approaches to the Interpretation of Prehistoric and Historic Built Environments, edited by E. Paliou, U. Lieberwirth, and S. Polla, pp. 19–48. 44. De Gruyter, Berlin; Boston.
Ingold, T. 2007. Lines. A Brief History. Routledge, London; New York.
Jay, M. 1988. Scopic Regimes of Modernity. In Vision and Visuality, edited by H. Foster, pp. 3–23. Dia Art Foundation—Discussions in contemporary culture 2. Bay Press, Seattle.
Lacoste, Y. 1976. La géographie, ça sert, d’abord, à faire la guerre. Maspero, Paris.
Llobera, M. 2003. Extending GIS-based visual analysis: the concept of visualscapes. International Journal of Geographical Information Science 17, pp. 25–48. DOI:10.1080/13658810210157732.
Llobera, M. 2005. New paradigms and methods for landscape research in archaeology. In Temps et espaces de l’homme en société. Analyses et modèles spatiaux en archéologie, edited by J.-F. Berger, F. Bertoncello, F. Braemer, G. Davtian, and M. Gazenbeek, pp. 43–53. Éditions APDCA, Antibes.
Malm, W. C. 2016. Visibility: The Seeing of Near and Distant Landscape Features. Elsevier, Amsterdam.
Mullins, P. 2016. Webs of Defense: Structure and Meaning of Defensive Visibility Networks in Prehispanic Peru. Journal of Archaeological Science: Reports 8:346–355. DOI:10.1016/j.jasrep.2016.05.022.
Newman, M. 2010. Networks: An introduction. Oxford University Press, Oxford; New York.
Ogburn, D.E. 2006. Assessing the level of visibility of cultural objects in past landscapes. Journal of Archaeological Science 33, 405–413. DOI:10.1016/j.jas.2005.08.005.O’Sullivan, D., and A. Turner. 2001. Visibility Graphs and Landscape Visibility Analysis. International Journal of Geographical Information Science 15(3):221–237. DOI:10.1080/13658810151072859.
Paliou, E. 2013. Reconsidering the Concept of Visualscape: Recent Advances in Three-dimensional Visibility Analysis. In Computational Approaches to Archaeological Spaces, edited by A. Bevan and M. Lake, pp. 243–263. Left Coast Press, Walnut Creek CA.
Peatfield, A. 1994. After the “Big Bang”—What? or Minoan Symbols and Shrines Beyond Palatial Collapse. In Placing the Gods: Sanctuaries and Sacred Space in Ancient Greece, edited by S. Alcock and R. Osborne, pp. 19–36. Clarendon Press, Oxford.
Ruestes, C. 2008. Social Organization and Human Space in North-Eastern Iberia during the Third Century BC. Oxford Journal of Archaeology 27(4):359–386. DOI:10.1111/j.1468-0092.2008.00314.x.
Schiffman, R. 1976. Sensation and Perception: An Integrated Approach. Wiley, New York.
Shang, H., and I. D. Bishop. 2000. Visual Thresholds for Detection, Recognition and Visual Impact in Landscape Settings. Journal of Environmental Psychology 20:125–140. DOI:10.1006/jevp.1999.0153.
Swanson, S. 2003. Documenting Prehistoric Communication Networks: A Case Study in the Paquimé Polity. American Antiquity 68(4):753–767. DOI:10.2307/3557071.
Thomas, J. 2009. On The Ocularcentrism of Archaeology. In Archaeology and the Politics of Vision in a Post-Modern Context, edited by J. Thomas and V. Jorge, pp. 1–12. Cambridge Scholars Press, Cambridge.
Tilley, C. 1994. A Phenomenology of Landscape: Places, Paths and Monuments. Berg, Oxford; Providence.
Torres, J., and R. Rodríguez Ramos. 2008. The Caribbean: A Continent Divided by Water. In Archaeology and Geoinformatics: Case Studies from the Caribbean, edited by B. Reid, pp. 13–29. University of Alabama Press.
Turner, A., M. Doxa, D. O’Sullivan, and A. Penn. 2001. From Isovists to Visibility Graphs: A Methodology for the Analysis of Architectural Space. Environment and Planning B: Planning and Design 28(1):103–121. DOI:10.1068/b2684.
Zhu, J., Y. Nie, H. Gao, F. Liu, and L. Yu. 2017. GIS-based Visibility Network and Defensibility Model to Reconstruct Defensive System of the Han Dynasty in Central Xinjiang, China. ISPRS International Journal of Geo-Information 6(8):247. DOI:10.3390/ijgi6080247.
PS. You may also check the article on landscape chambers, which puts into practice some ides exposed here (namely the visibility graph analysis).