Visibility analysis plugin is now available in QGIS 3.0! It has been completely refurbished: from now on it will be integrated into the “Processing toolbox”. This is a more appropriate habitat for the algorithm because of integration with the QGIS toolshed. It can be now combined with all the fancy geoprocessing tools (GRASS, SAGA etc).
Previous experimental versions for Processing were published as Senscape. The whole thing remains experimental, so please check twice the results and do report any issues you might find.
What’s new?
- analysis radius is variable, it can be specified individually, for each point
- the algorithm will produce a textual report, which is very handy for statistical analysis (it provides information for quantifying the ratio of visible vs non-visible areas)
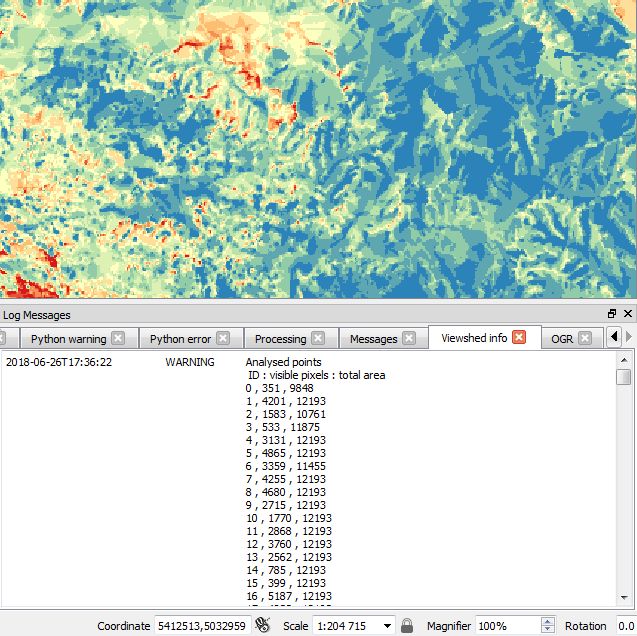
The report is available in “Log Messages” panel (go to View >> Panels)
How does it work?
Since handling multiple parameter and algorithm tweaks got rather complicated in Processing layout, the routine is now divided into two parts. First, the observer points need to be created and assigned parameters such as observer height or analysis radius. These are, then, fed to the algorithm. Once created, observer points can be modified along with accompanying parameters, but table field definitions should stay unchanged. In fact, all the algorithm does is formatting field names and data types (integer, float etc.): this can be made manually, if necessary.
The idea behind this architecture is to separate variable parameters from those specified globally, such as algorithm precision or Earth curvature. ESRI’s viewshed module takes a similar approach.
Example of a custom module
The downside of the two-step routine is that it takes more clicks than the old Viewshed plugin … but here comes the Processing framework to our rescue! Let’s make it simple again and skip the process of creating observer points.
(Following screenshots were made in QGIS 2, but the idea is much the same in QGIS 3)
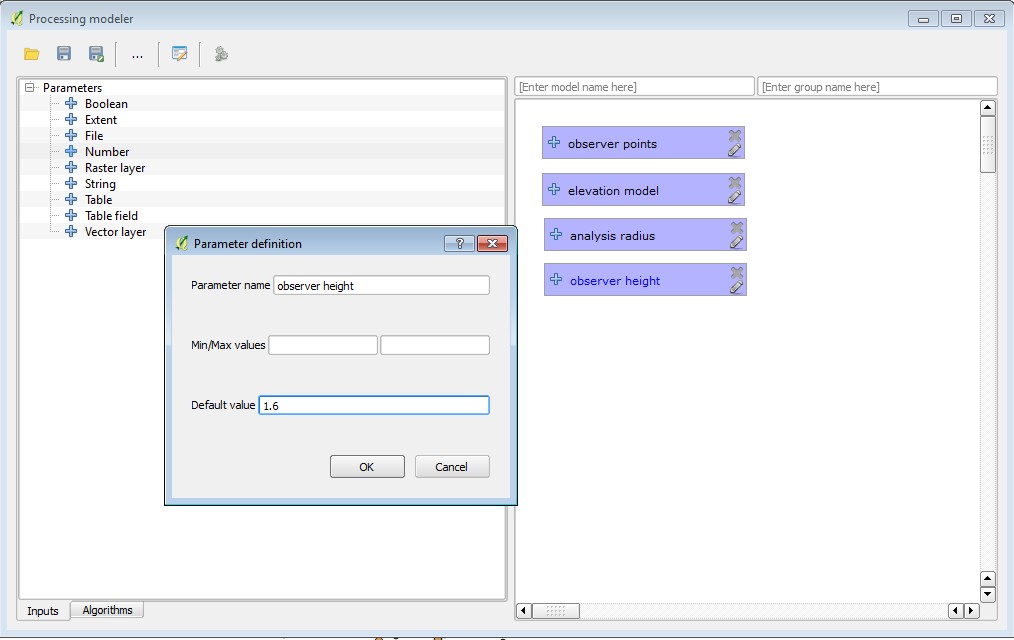
Open Processing » Graphical Modeller and create a new script. We will use some basic parameters: elevations raster and observer points (obviously), and global observer height along with analysis radius.
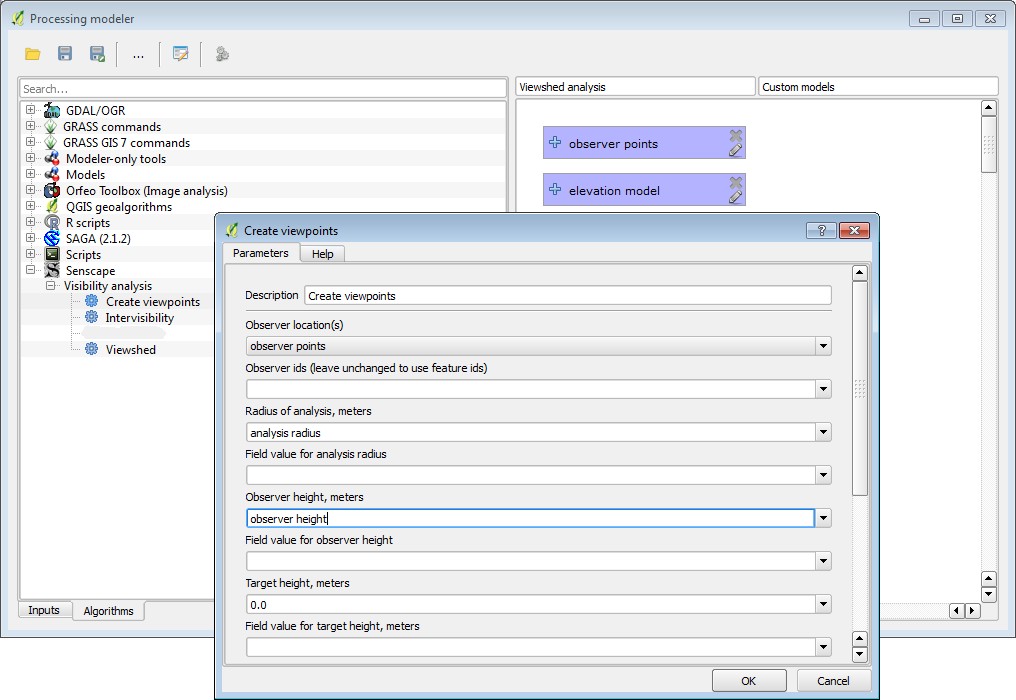
Then we slide-in the “Create points” routine and use created parameters (raster parameter is needed only for displacement of points to a higher position)
Finally, we stream the result to the viewshed algorithm (if observer points are multiple, take care to choose sum as the output method!)
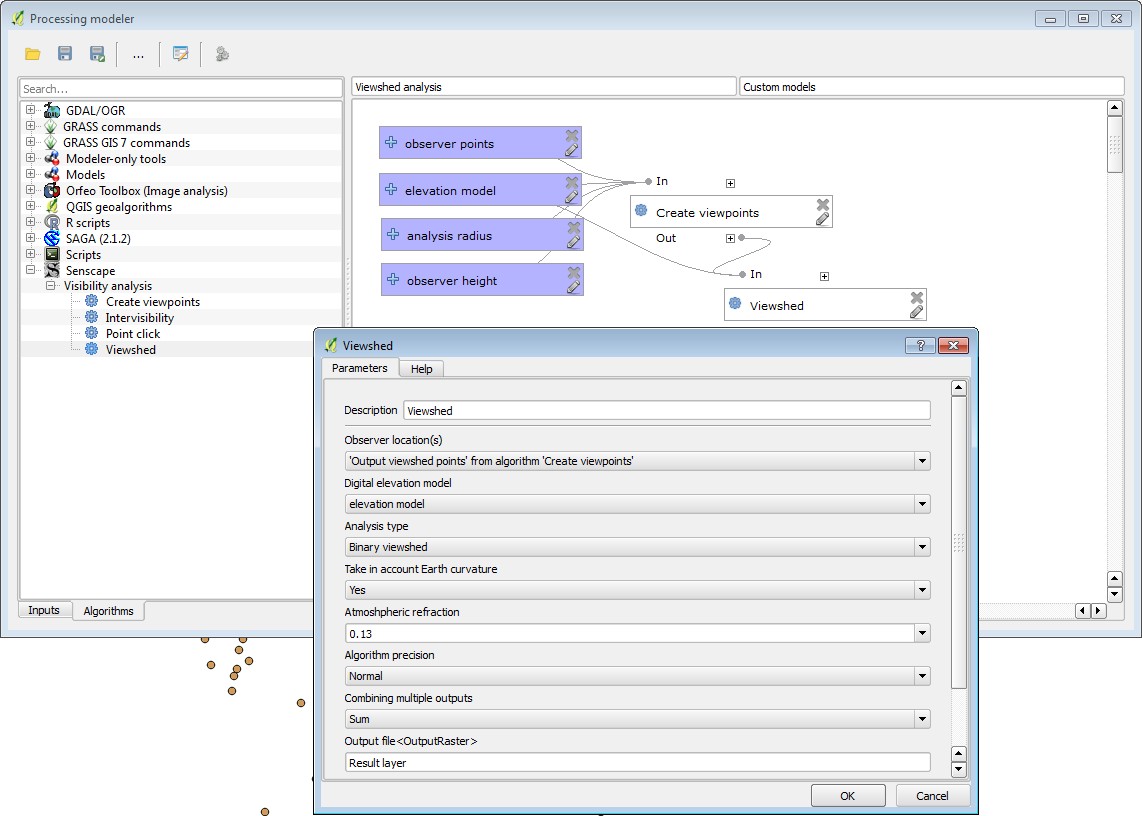
And here it is, a super-simple (and customised) viewshed routine to be consumed without any moderation.
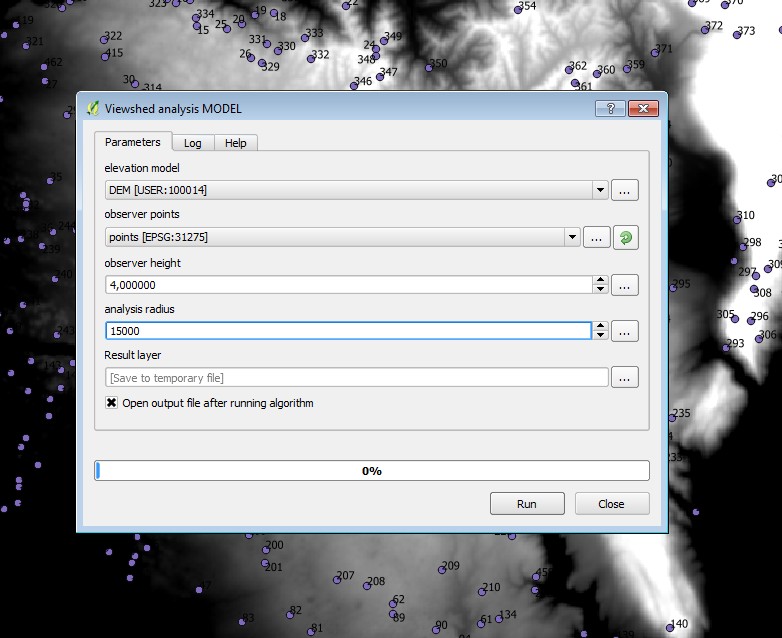
Datasets used can be downloaded from the Viewshed plugin repo
Plugin homepage here